
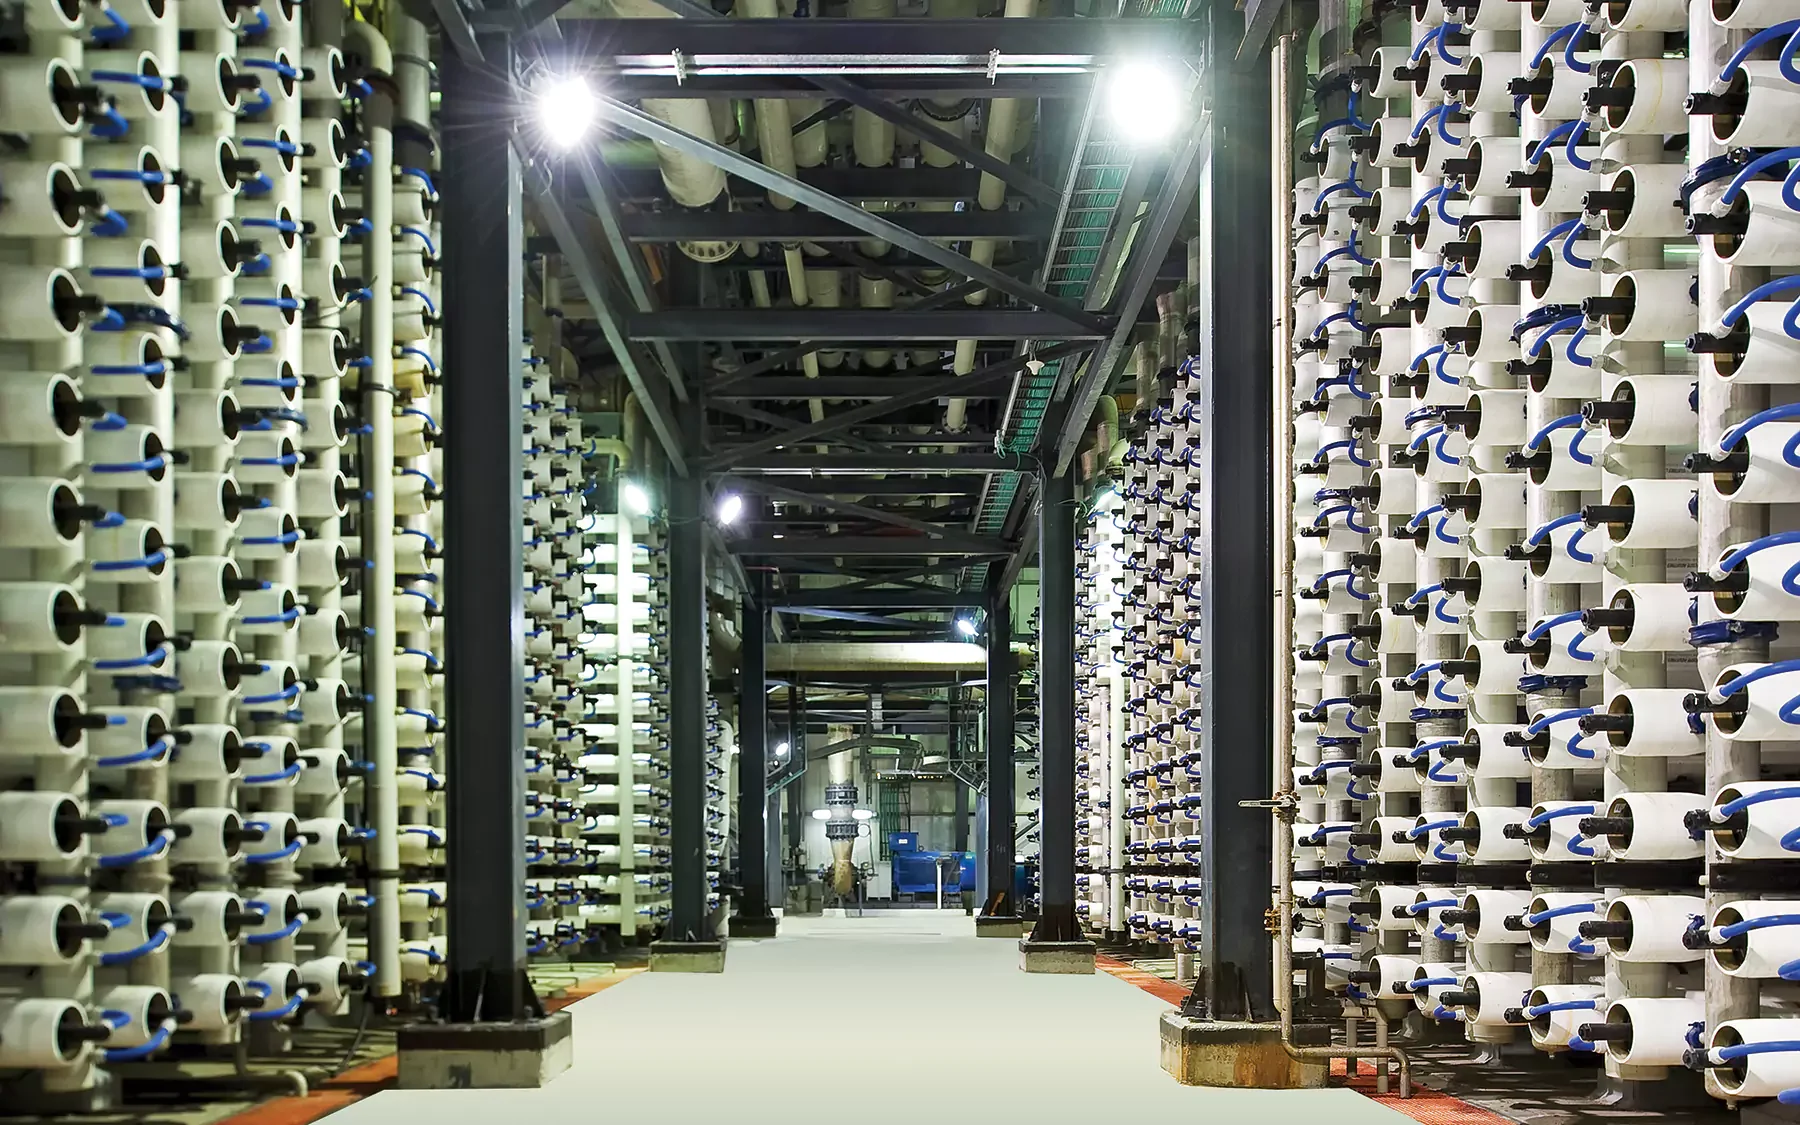


Size and structure of the global desalination technology market
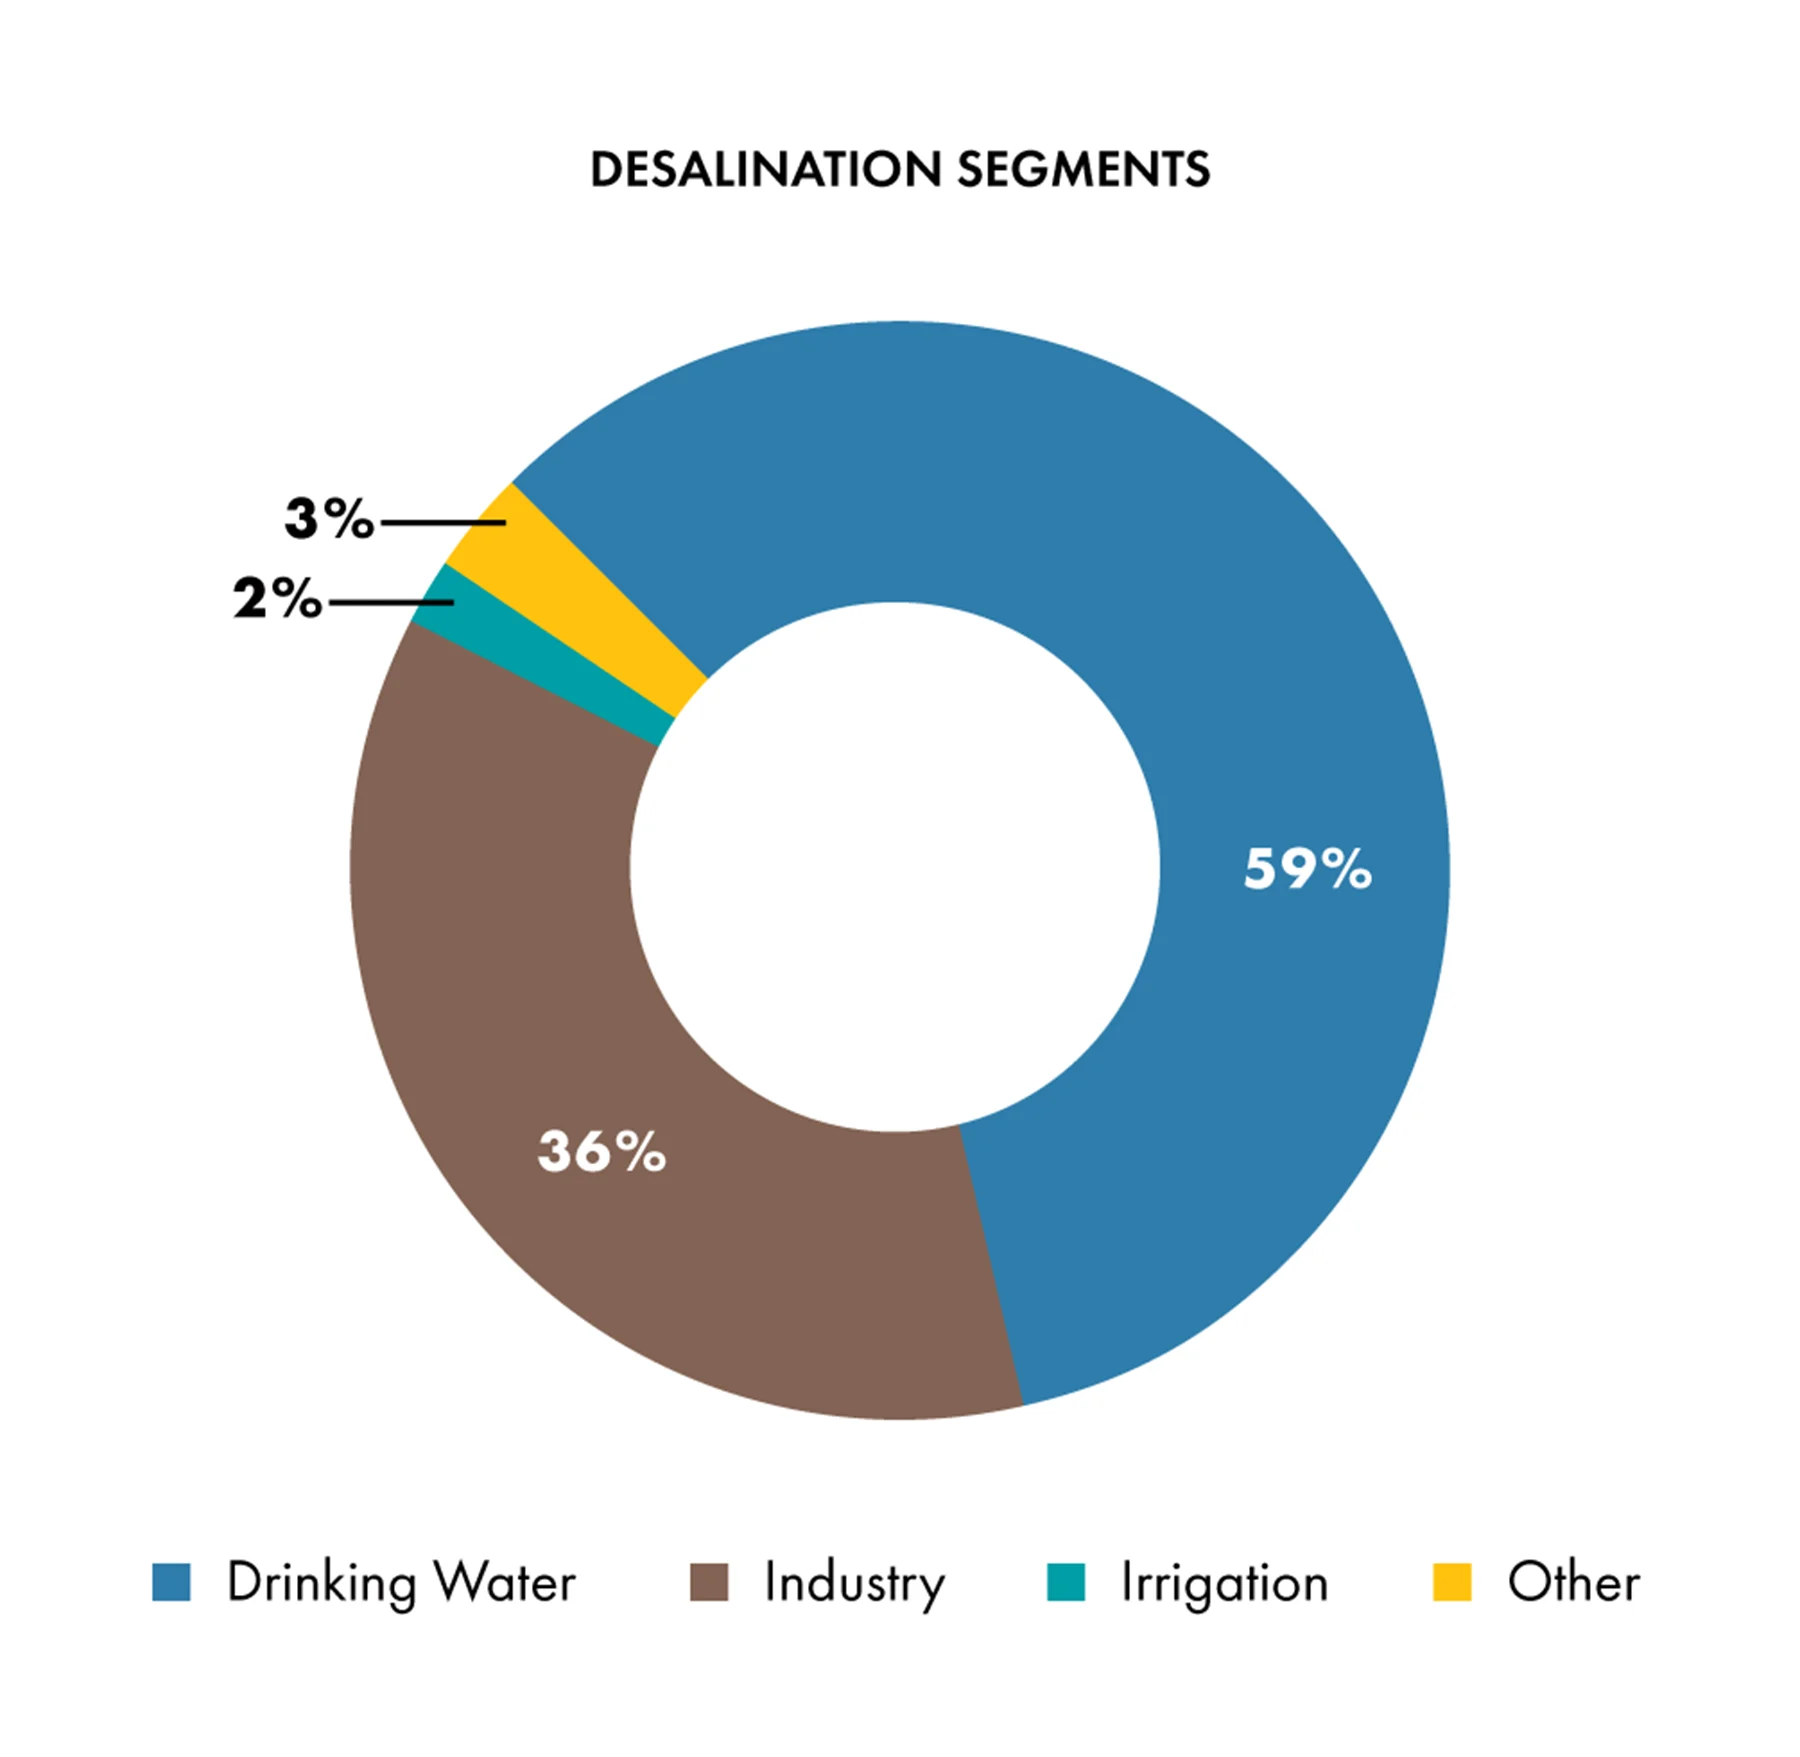
Today there is approximately 100 million m3/d water desalinated globally in all sectors including municipal drinking water and all industrial uses. Estimates vary among sources, and there are constantly new plants coming online, but this rough figure is verified by several sources.1, 2, 3 Large single city municipal desalination plants are in the general range of hundreds of megalitres per day, and the unit of megalitres per day (ML/d) will be used in the rest of this section to provide a consistent comparison of the size and scale of several global municipal desalination plants alongside industrial and copper mining desalination plants. Municipal drinking water represents 59% of the worldwide installed desalination capacity, and total industrial desalination is 36%.4
Figure 52 - Global desalination applications
Examples of some of the largest municipal and mixed municipal/industrial desalination plants in the world are shown in the table below.
Table 5: Scale of a few municipal desalination plants
| Site | Capacity [ML/d] |
|---|---|
| Shoaiba, Saudi Arabia | 1,282 |
| Sorek, Israel | 1,172 |
| Ras Al Khair, Saudi Arabia | 1,036 |
| Taweelah, UAE | 909 |
| Rabigh, Saudi Arabia | 600 |
| Fujairah, UAE | 587 |
| Melbourne, Australia | 400 |
| Sydney, Australia | 250 |
| Tianjin, China | 200 |
| Carlsbad, USA | 189 |
| El Paso, USA | 104 |
| Tampa Bay, USA | 95 |
Within industrial desalinated water, total mining and metals combined (copper and other metals) are about 2500 ML/d or about 7% of the global industrial desalinated water market.5
Size, structure and installation examples from the copper mining desalination market
Cochilco monitors and regularly reports on water consumption in the Chilean copper mining industry. The table below is adapted from the organisation’s 2017 report6 with amendments for a number of recent projects announced in internet stories plus one desalination plant in southern Peru.
Table 6: Selected copper mining desalination plants
| Start-up date | Status | Ownership | Name | Desal capacity [ML/d] | List |
|---|---|---|---|---|---|
| Planning | Planning | Trends Industrial | ENAPAC multi-user | 227 | Other |
| Operating | Operating | BHP | Escondida EWS | 216 | Cochilco 2017 |
| Planning | Planning | Codelco | Chuquicamata | 169 | Other |
| 2021 | Feasibility | Teck | Quebrada Blanca | 112 | Cochilco 2017 |
| Planning | Glencore / Anglo / JCR | Collahuasi | 91 | Other | |
| 2020 | Feasibility | BHP | Spence Growth | 86 | Cochilco 2017 |
| 2021 | w/o EIA | Goldcorp Teck | NuevaUnion | 64 | Cochilco 2017 |
| 2020 | Feasibility | Codelco | RT Sulphides | 54 | Cochilco 2017 |
| Planning | Planning | BHP | Cerra Colorado | 49 | Other |
| Operating | Operating | BHP | Escondida - Coloso | 45 | Cochilco 2017 |
| 2025 | w/o EIA | Freeport McMoran | El Abra | 43 | Cochilco 2017 |
| 2020 | Feasibility | AMSA | Los Pelambres | 35 | Cochilco 2017 |
| Operating | Operating | Lundin | Candeleria | 26 | Cochilco 2017 |
| 2020 | Feasibility | Mantos Copper | Desarrollo Mantoverde | 22 | Cochilco 2017 |
| 2018 | Feasibility | Lundin | Candeleria 2030 | 17 | Cochilco 2017 |
| Operating | Operating | Mantos Copper | Mantoverde | 10 | Cochilco 2017 |
| Operating | Operating | Antofagasta | Esperanza | 4 | Other |
| Operating | Operating | BHP, Glencore, Teck, etc. | Antamina / Talara, Peru | 2 | Other |
Several of the larger Chilean desalination plants are similarly sized to municipal desalination plants in the USA or Australia.
SWRO and BWRO applications are standard technology at water stressed sites such as copper mine sites in northern Chile, southern Peru, and at non-copper mine sites such as the iron mining of CITIC Pacific Mining at Cape Preston, Karratha, Australia (140ML/d). RO is standard for effluent sites such as the Queensland coal seam gas wastewater treatment sites (>100ML/d).
How large is “large”? Comparison of desalination plant scales
Comparing the scale of various global civil/municipal seawater desalination plants with the largest copper mining desalination plants demonstrates that the size of the largest civil/municipal plants are five times the size of the largest mining desalination sites. The total number of 16,000 installed desalination plants, and the total number of fewer than 50 copper mining desalination plants further indicates the market “drive” for innovation and cost reduction is mainly coming to the desalination industry from outside the mining sector.
Figure 53 - Comparison of desalination plant scales
Typical SWRO plant technology / flow diagram
A typical SWRO process has high pressure feed pumps, pre-treatment filtration in progressively finer stages, a multitude of parallel and series RO cartridge units, an optional pressure energy recovery unit, and chemical dosing (depending on the use of the water, e.g., chlorination for drinking water). The energy intensity of the process unit is dominated by the pressure drop within the reverse osmosis cartridges which consume 71% of the energy at a SWRO desalination plant. Pretreatment is in the range of 11% of the energy, and the other energy users are mainly the various pumps (feed pumps, water delivery, brine concentrate outfall, etc.)7 Of course, thermal desalination has different energy requirements. Also, note that mining water is not purified to the same specification.
The basic reverse osmosis unit contains a number of spiral wound cartridges. The current industry standard is a large industrial 200mm diameter (8-inch) cartridge, possibly due to the maximum manual handling weight of a wet, fouled cartridge. There are unique designs including a large diameter “barrel” design.
The basic pretreatment process is a reversible flow backwash sand filter to remove gross particulates followed by traditional cartridge filters. Seawater can be treated with chemicals to precipitate some dissolved ions that are more effectively removed by traditional filtration, thus lowering load on subsequent filter units.
Partial list of technology suppliers
A number of engineering and process equipment companies specialise in the plant design services of seawater desalination plants or the supply of specialist components such as reverse osmosis membranes or pumps. A partial list of suppliers is provided below:
ACCIONA, https://www.acciona.com.au/projects/swro-adelaide/
Bechtel, https://www.bechtel.com/projects/escondida-water-supply/
Black & Veatch, https://www.bv.com/projects/black-veatch-clients-sustainability-project-will-increase-production-worlds-largest-copper
CSM, http://www.csmfilter.com/csm/01com/company_csm.asp
Doosan, http://www.doosanheavy.com/en/products/water/plant01/
Dupont, https://www.dupont.com/water/industries/desalination-seawater-reverse-osmosis-membranes.html
Hydranautics Nitto, https://membranes.com/solutions/products/ro/swc/
IDE, https://www.ide-tech.com/en/solutions/desalination/?data=item_1
Isle Utilities, https://www.isleutilities.com
Koch, https://www.kochseparation.com/technologies/membrane-filtration/
LG Chem, https://www.lgwatersolutions.com/en/market/desalination
Lenntech / Trisep, https://www.lenntech.com/products/membrane/trisep-1.htm
Osmoflo, https://www.osmoflo.com/en/markets-water-treatment/mining/
Suez, https://www.suezwatertechnologies.com/applications/desalination
Toray, https://www.toray.com/products/membranes/mem_0040.html
Veolia, https://www.veoliawatertechnologies.com/en/applications/seawater-desalination
Energy intensity of SWRO
Seawater desalination requires considerable energy. The range of technologies in the broad category of desalination is described below in this section.
Among the main technologies, the energy required for reverse osmosis is mainly electric power to the high-pressure pump system. The thermally driven technologies require process heating. Today several of the thermal units in the Middle East use fossil fuel heating or waste process heat, but concentrated solar thermal power may be an alternative in a carbon constrained future scenario.
The energy intensity of pumping systems can also be high, especially in mountainous regions such as the Atacama Desert, Chile where SWRO plants operate at sea level, and mining operations are at high elevations.
SWRO energy and cost benchmark data
Ample data exists in water engineering literature for the cost and energy intensity to supply drinking water for municipal water systems around the world. The table below shows a comparison of the energy demand for a range of different drinking water supply alternatives.8, 9 Thermal technologies are also added for comparison.
Table 7: Energy intensity of desalination applications
| Drinking water supply alternative | Energy use [kWh/m3] | Reference |
|---|---|---|
| Conventional treatment of surface water | 0.2 to 0.4 | Voutchkov |
| Water reclamation | 0.5–1.0 | Voutchkov |
| Indirect potable reuse | 1.5–2.0 | Voutchkov |
| Brackish water desalination | 1.0–1.5 | Voutchkov |
| Desalination of Pacific Ocean water | 2.5–4.0 | Voutchkov |
| Seawater Reverse Osmosis | 4–6 | Omar et al. |
| Multi-Effect Distillation (thermal) | 14–21 | Omar et al. |
| Multi-Stage Flash (thermal) | 20–27 | Omar et al. |
Seawater reverse osmosis desalination plants are somewhat a global commodity in terms of equipment supplied, but the large number of installations span a wide range of feed water qualities, installation labour costs and site-specific installation factors. The table below shows a range of water costs (inclusive of operation and capital costs) and energy use.10
Table 8: Cost and energy requirements for seawater RO desalination
| Classification | Cost of water [US$/m3] | SWRO system energy use [kWh/m3] |
|---|---|---|
| Low-end bracket | 0.5–0.9 | 2.5–2.8 |
| Medium range | 0.9–1.5 | 2.9–3.2 |
| High-end bracket | 1.6–3.0 | 3.3–4.0 |
| Average | 1.1 | 3.1 |
Mining applications generally would not require the same level of purification, and desalination costs and energy are probably on the low end of the ranges above or even below these ranges depending on the unique site water specification.
Voutchkov reviews a number of trends in technology development and alternatives in design. Generally, SWRO is eight to ten times more expensive than surface water. Energy costs for SWRO supplies are 25% to 40% of production costs of the water. There may be a theoretical minimum of 0.7 kWh/m3 water production at 100% recovery, but many plants operate at pragmatic actual recovery rates at only around 50%, so energy is typically 1.1 kWh/m3. A long-term US program called the Affordable Desalination Collaboration has yielded a number of improvements in technology. Further improvements are expected. Actual capital costs are project and site specific.
Key design factors that affect SWRO energy intensity
SWRO plants can be designed to take advantage of certain process flow diagram configurations, certain collocation or circular design features, and certain energy savings equipment features. These alternatives are summarised in the table below:11
Table 9: Factors affecting RO energy demand
| Factor | Energy saving technology trends | Potential for energy savings (as % of industry average) |
|---|---|---|
| Source water temperature | Use of warmer source water (collocation with power generation plants) | 3 to 5% |
| Source water salinity | Use of lower-salinity source water or blend of seawater and brackish water | Over 50% |
| Membrane element and system energy and productivity losses | Use of higher productivity elements | 5 to 15% |
| Application of lower-energy & cost RO system configurations | ||
| High pressure RO feed pump efficiency | Maximizing pump and motor efficiency by the use of large pumps serving multiple RO trains | 5 to 10% |
| Recovery of energy from RO concentrate | Use of isobaric chamber type technologies | 10 to 15% |
Types of water
Primary water feed for copper mining sites can come from nature as seawater, inland brackish water or freshwater from surface or underground sources. There is potential for innovation in the use of wastewater from manmade sources including secondary treated municipal wastewater, concentrate / reject wastewater from municipal RO plants as a feed to industrial processes such as mining, and industrial process water / wastewater that is recycled from a copper mine itself or from other industrial sources. The incoming water quality, dissolved ions, and unique chemistry must be known to specify desalination technology.
List of emerging desalination technologies
Reverse osmosis is a robust and economical alternative for a wide range of seawater desalination applications. Thus, it can be generalised that SWRO is considered the state of the art for purifying seawater for coastal copper mining locations. However, it is not the only technology available, and there are many other new technologies in service and undergoing research and development. It is worthwhile looking forward to the Zero Emission Copper Mine of the Future to consider all the available technologies that currently hold notable market positions and consider how they may develop further in the coming years towards the realisation of the carbon neutral era.
The main technology categories are:
Pressure driven technologies
Electrically driven technologies
Thermal evaporation technologies
Ion Exchange
Adsorption Desalination
Zero Liquid Discharge, an adjunct technology set
Overview of pressure-driven technologies
The main pressure driven technologies are Reverse Osmosis (RO) and Nano Filtration (NF). Some technology overviews merge the two technologies as they are physically similar, i.e., both are generally spiral wound cartridges contained within pressure vessels. The main difference is the size of the filter pore and thus the type of ion or molecule that will be blocked by the membrane filter media.
Generally, a series of cheaper and progressively finer filtration steps precedes nanofiltration or the final RO membrane. Calcium, magnesium and larger divalent metal ions including copper are effectively separated by NF. RO effectively separates sodium and chloride.
Figure 54 - Comparison of RO and filter technologies
NF and RO media are usually contained in a spiral wound cartridge, and typically, multiple (especially seven) cartridges are held in series to purify the water. Some higher capacity systems use “barrel” flow distributions.
RO is the main technology in use globally. RO is the “work horse” of modern desalination.
Figure 55 - RO membrane cartridge flow. Source: Daniele Pugliesi, CC-BY3.0
Introduction of electrically-driven technologies
Electrodialysis (ED) and Electrodialysis Reversal (EDR) are the main two commercial technologies today (low take-up, Horizon 2). Electrodeionization, Capacitative Deionization (CDI), and Electrodialysis Metathesis (EDM) are emerging technologies (Horizon 3). Metal ions at trace levels in water or dilute acid may be good targets for electrically-driven technologies. Electrochemical desalination is a further permutation involving ultrafiltration, electrodialysis, and continuous deionisation. Evoqua broke off from Siemens and developed technology from a Challenge Grant by the Singapore Government. This has potential for 5% to 15% reduction in costs. The broader question would be how might copper industry / mining industry evaluate electrochemical purification of their own intermediate process waters in a Horizon 3 test.
Thermal technologies
The main thermal technologies are Membrane Distillation (MD), Multi-Effect Distillation (MED), Vapour Compression Distillation (VCD), and Multistage Flash Distillation (MFD). Thermal desalination is especially practiced in civil/ municipal systems in the Middle East with fired heated pressure vessels or with waste heat. There is clearly potential to practice thermal desalination with concentrated solar power (CSP) in many global locations.12 As shown above in Table 7: Energy intensity of desalination applications, thermal desalination uses more energy, but it is heat energy, not electricity. CSP systems operate on molten salt solutions at a range of 800C to perhaps 1100C or in loops with molten sodium. These streams exchange heat with water to raise high pressure steam that drives a turbine. Molten salt systems can store heat for process heating or conversion to electricity after sundown.
For tailings liquors, a combination of RO and thermal technologies have been used in mining applications. Researchers at the University of Antofagasta report results from multi-stage direct contact Membrane Distillation to extract water from a hot stream (60C) of sulphuric acid and metal ions over a 0.2micron PVDF membrane into a cool water stream (20C).13
Key ideas / opportunities for innovation are:
Membrane Distillation (Horizon 2)
Multi-Effect Distillation (Horizon 2)
Multistage Flash Distillation (Horizon 2)
Concentrated Solar Power thermal heat (Horizon 2/3)
CSP sundown storage (Horizon 2/3)
Ion exchange
Ion exchange refers to a group of processes that pass saline water over a packed bed of resin beads, a resin membrane, or a liquid phase to exchange calcium and magnesium in the water for sodium to remove water hardness. The Ca2+ and Mg2+ can be converted to carbonates and removed by precipitation. The process is reversed by washing, electrolysis or electrophoresis.
Adsorption Desalination
Like Ion Exchange, Adsorption Desalination works by passing water through a silica gel packed bed, but this is an emerging hybrid physical-thermal process which first heats the saline water to create a vapour, then it captures the pure water vapour on the surface of the adsorbent. Additional heat is applied to drive the purified water off the surface of the silica.14 The temperatures are low enough that waste heat can be used. (emerging, Horizon 3).
Zero Liquid Discharge
Zero Liquid Discharge (ZLD) or near-ZLD is a bolt-on technology to desalination that crystallises salt from seawater brine concentrate and removes it as solid salt crystals. Applied to tailings, ZLD allows dry stacked solids to be created. Forward osmosis can use salt to concentrate reject brine and may possibly have integration with concentrated solar power that could yield 20 to 35% energy reduction for ZLD. Membrane distillation shows a high degree of academic research interest, and researchers cite 20 to 35% energy reduction for MD-ZLD. “Dewvaporation” is an emerging technology alternative to RO. It works when there is dry desert air, saline water, and free or low-cost waste heat. Dewvaporation may yield a 15% to 25% theoretical cost reduction, is perhaps 10 years away as a Horizon 3 opportunity. Adsorption desalination is another emerging technology alternative to RO. AD adsorbs water from saline feed onto silica gel and desorbs pure water with free or low-cost waste heat. NUS Singapore is working on demonstration in Saudi Arabia. Energy is only 1.4 kWh/m3 if there is free heat available for the desorption step. AD-ZLD is Horizon 2/3.
Biomimetic processes
Biomimicry is the industrial application of biochemical processes from nature. This includes a wide range of emerging technologies including biomimetic membranes and wet bioleaching. Biomimetic membranes and bioleaching are Horizon 3.
Emerging innovation possibilities
Collocation / Circular Economy integration:
It may be feasible to integrate copper desalination water feed with wastewater discharge, thermal power water discharge, or thermal power waste heat exchange. Voutchkov describes how integration of SWRO desalination plants with coastal thermal power plants (e.g., fossil fuel fired power with steam turbines) could yield efficiencies, but in a carbon constrained future, fired power plants may be converted to hydrogen/ammonia gas turbine or steam turbines linked to concentrated solar thermal power (CSP). Brief discussions with one Australia-based concentrated solar thermal power start-up company that uses indicated that coastal sites are not ideal for CSP due to the effect of saltwater surf spray interfering with Direct Normal Irradiance (DNI) of solar energy. Voutchkov further suggests that regional municipal drinking water brackish brine collection can be cleaner than seawater feed for reverse osmosis, and a sort of circular economy recycling of brackish brine at inland locations can be more energy efficient than seawater feed. He describes integration of secondary wastewater treatment discharge being tested in Japan and South Africa to feed reverse osmosis plants instead of seawater.
The Singapore Changi NEWater process uses secondary wastewater treatment discharge to feed reverse osmosis plants instead of seawater.
Warmer seawater feed (Horizon 2/3)
Power plant collocation / waste heat - circular economy (Horizon 2)
Alternate feed water source - circular economy (Horizon 1/2)
Further RO membrane evolution:
Trends towards higher surface area, improved permeability, and denser leaf packing have been underway for some decades. Cartridge flow rates have increased from 18 m3/day in the 1990s, to 28 m3/day in 2003, 34 m3/day in 2004, and 55 m3/day in 2017.15 Emerging materials of construction improvements are underway. Nano membranes are now adding a nano zeolite top layer or carbon nanotube layer with holes perfectly sized to allow water molecules to enter and to reject larger ions. These may yield 10 to 20% higher water production and use 10 to 15% less energy.
New RO membrane materials (Horizon 1/2)
New RO configurations (Horizon 2)
Optimised RO membrane and pump configurations:
There are a number of incremental improvements. Standard RO membrane vessels tend to be 200mm diameter / 8-inch with seven membrane cartridges (5-1-1). Efficiencies can be gained by using three different types of membranes to balance flux in the first cartridge and second cartridge. Engineers report 5 to 15% energy savings possible for a present pressure vessel to be reconfigured at the next plant shutdown, cartridge changeout. Low recovery plant design is also reported. Engineers drop the design recovery to 35% for SWRO or 65% for BWRO. This reduces energy, but there is a big water outflow of concentrated brine. Pump technologies improvements are reported. Larger, high efficiency multistage centrifugal pumps are reported. Typical pump efficiency is now 80%. A single larger pump instead of two half-duty pumps can open up a better efficiency of 85%. Ashekelon, Israel has an 88% efficiency large pump. The theoretical limit is approximately 90% efficiency. Alternatively, multiple smaller high efficiency positive displacement (PD) pumps can be applied. PD pumps can deliver 94-97% efficiency but may be less favoured for capital cost reasons.
• RO configuration upgrade (Horizon 1/2).
• Low recovery SWRO/BWRO plants (Horizon 2)
• Incremental SWRO pump efficiencies (Horizon 1/2)
Energy recovery from brine concentrate:
A “turbocharger” centrifugal technology is a standard feature in the latest desalination plants. Pressurised concentrated brine flows through a Pelton centrifugal turbine or a positive displacement piston pump that drives a seawater feed piston pump to convert and recover energy. SWRO fluid energy recovery is Horizon 1/2.
Economy of scale:
Shared infrastructure like the Chilean piping networks could be feasible in new locations. Shared infrastructure is Horizon 1/2.
Varying seawater treatment:
Chilean mines have used or tested direct untreated seawater,16 partially treated seawater (TSW), desalinated seawater and discard brine concentrate17 for different copper ore treatments. SWRO discard brine with concentrated chloride did not aid dissolution of chalcopyrite, but also did not harm, and temperature of leaching was a more significant factor. Direct seawater is used at the Chilean sites of Centinela, Sierra Gorda, and Antucoya. Calcium and magnesium cause problems with flotation, especially if clay or kaolin are present in the ore. Alkaline treatment, CO2 and bioprecipitation with bacteria are used for precipitation removal of Ca2+ and Mg2+.18 The relative costs of treatment and pumping are shown below.
Corrosion is an issue with raw seawater and TSW requiring some special coatings, water washing, additional maintenance, and rubber coatings on various elements of mills, screens, crushers, cyclones, flotation cells and thickeners.19
- Treated seawater is Horizon 1/2/3 depending on the previous experience at a mining site or in a mining region with saline flotation operation and equipment upgrades. Application to all ore bodies may not be equivalent.
Table 10: Cost of direct seawater and treated seawater in Chile
| Cost by water quality type [USD$/m3] | |||
|---|---|---|---|
| Delivery point | SWRO | TSW | SW |
| Sea level | $1.42 | $0.47 | $0.30 |
| Flotation plant (160km, 3500 m.a.s.l.) | $5.58 | $4.70 | $4.53 |
Technology development programs and technology forecasts
Unlike a number of the strictly mining or copper mining technologies in the rest of this report, there is a large global scale, large count of installations, and a wide range of water desalination technologies (water purification and wastewater treatment) in development. The Phase 1 Zero Emission Copper Mine of the Future report offers Enabling Levers for strategic coordination and success. Public policy, collaborative industry frameworks, and an open innovation mindset have been applied in the civil engineering, chemical engineering and water engineering technologies presented in this section. Desalination does not lack technology forecasting, global alignment and open innovation for international alignment to the UN SDGs. This section and its explicit (non-secretive) data are examples of what can be achieved with international publicly funded research programs aligned to real-world industry connections. Plant economics data and techno-economics forecasting data is available for long-term industry-wide research planning.
Voutchkov forecasts overall SWRO and other alternative desalination improvements on a two-decade time horizon as described below.20
Table 11: Nikolay Voutchkov Desalination Technology Forecast (2017)
| Engineering parameters and performance for best-in class desalination plants | |||
|---|---|---|---|
| Innovation Timeframe | |||
| Parameter | Year 2017 | Within 5 years [to 2022] | Within 20 years [to 2037] |
| Total electrical energy use [kWh/ m3] | 3.5–4.0 | 2.8–3.2 | 2.1–2.4 |
| Cost of water [USD$/m3] | 0.8–1.2 | 0.6–1.0 | 0.3–0.5 |
| Construction cost [USD$/MLD] | $1.2–$2.2 | $1.0–$1.8 | $0.5–$0.9 |
| Membrane productivity [m3/ membrane] | 28-47 | 35-55 | 95-120 |
Caldera and Breyer provide detailed learning curve analysis of desalination capital costs.21
The figure below is one example of retrospective cost analysis of small and medium-sized desalination plants with low capex numbers (small <1,500 and medium <$USD1,000/m3/d) are removed. Their analysis estimates a learning rate from 1977 to 2015 of 14.62%.
Figure 56 - Retrospective desalination learning curve analysis. Source: Caldera and Breyer
Mayor offers learning curve analysis and prospective capital cost predictions to 2050.22
Mayor estimates cost reduction prospects for thermal technologies of 6-8% by 2030, 8-10% by 2050. She estimates RO cost reductions of 12-33% by 2030 and 18-66% by 2050. These efficiencies are estimated based on technology learning curve effects and economies of scale effects. Mayor describes desalination technology as the nexus of water, energy and land challenges.
Figure 57 - Prospective desalination learning curve analysis. Source: Mayor
