{
"componentChunkName": "component---src-gatsby-entities-page-tsx",
"path": "/appendices/wikiore-22-natural-deportment-characterisation",
"result": {"data":{"platform":{"page":{"id":"65d2edb6ebf7bb9388ffb014","name":"Natural Deportment Characterisation","slug":"wikiore-22-natural-deportment-characterisation","typeLabel":"Page","badge":null,"path":"/appendices/wikiore-22-natural-deportment-characterisation","updated":"2023-07-29T10:23:49.00","__typename":"Platform_Page","_schema":{"label":"Page","pluralLabel":"Pages"},"title":null,"pretitle":null,"subtitle":null,"titleRich":{"id":"65d2edb6ebf7bb9388ffb014_titleRich","text":""},"subtitleRich":{"id":"65d2edb6ebf7bb9388ffb014_subtitleRich","text":""},"published":"2023-07-29T10:23:49.00","content":{"id":"65d2edb6ebf7bb9388ffb014_content","text":"Introduction[](#Introduction)\n=============================\n\n[](tiki-editpage.php?page=%3Ca+href%3D%22tiki-index.php%3Fpage%3DNatural-Deportment%22+title%3D%22Natural+Deportment%22+class%3D%22wiki+wiki_page%22%3Enatural+deportment%3C%2Fa%3E)[natural deportment](/pages/wikiore-natural-deportment) laboratory testing aims to determine if specific [assay](https://en.wikipedia.org/wiki/Assay) elements (as a proxy for mineralogy) are preferentially deporting by size. Typically expressed as a systematic increase in concentration in finer size fractions. \n \n[assay](https://en.wikipedia.org/wiki/Assay)s from a series of size fractions for each sample are used to generate Response Curves. A mathematical function is then calculated across individual curves to generate a [Response Ranking](/sub-topics/natural-deportment-characterisation) (RR) - a single number used to describe the magnitude of a Response Curve. [Response Ranking](/sub-topics/natural-deportment-characterisation)s are used as inputs into [Grade Engineering](/pages/wikiore-introduction-to-grade-engineering) [block model](https://en.wikipedia.org/wiki/Mineral_resource_estimation#Resource_block_model)s, process simulations and economic evaluations. \n \nTesting can be carried out at drill core, blast hole chip or ROM scale although transforms are required to compare different scales. drill core testing is referred to as '[variability testing](/sub-topics/natural-deportment-characterisation)'. Testing of material at ROM scale is referred to as '[bulk testing](/sub-topics/sampling)', up to and including Production Trials. Depending on [opportunity assessment](/sub-topics/opportunity-assessments) requirements and site considerations a selection will be made regarding an appropriate sample type to test. \n \nTesting programs are conducted in two stages:\n\n1. An initial evaluation phase to select size fractions that generate optimal mass distributions typically involving 5-6 size fractions, and\n2. Routine testing based on a smaller number of size fractions (typically four) selected based on stage 1 mass results.\n\n[variability testing](/sub-topics/natural-deportment-characterisation)[](#variability_testing)\n==============================================================================================\n\n[variability testing](/sub-topics/natural-deportment-characterisation) can be carried out using coarse residues generated by [crushing](https://en.wikipedia.org/wiki/Crusher) during routine laboratory [assay](https://en.wikipedia.org/wiki/Assay) preparation as a precursor to pulverisation. Many projects/sites routinely store coarse residues specifically for future testing or check [assay](https://en.wikipedia.org/wiki/Assay)ing. In this case stored coarse residues can be used for cost effective testing. Stored pulps are not suitable for [variability testing](/sub-topics/natural-deportment-characterisation) as material has undergone excessive breakage and [natural deportment](/pages/wikiore-natural-deportment) signatures have been lost. \n \n[crushing](https://en.wikipedia.org/wiki/Crusher) protocols for coarse residues vary between sites and companies. These residues are produced with the aim to reduce the top size of a [particle size](https://en.wikipedia.org/wiki/Particle_size) distribution to a statistically suitable point for accurately splitting a portion to be used for fine pulverising prior to chemical [assay](https://en.wikipedia.org/wiki/Assay)ing. A typical top size for coarse residues is 99% passing -3.35mm or the equivalent #6 mesh (occasionally referred to as 80% passing 2mm). \n \n[particle size](https://en.wikipedia.org/wiki/Particle_size) distributions are a function of crusher gap settings, drill core sizes and rock hardness. Crusher gap settings in particular can vary between laboratories or drift over time. Within limits this variability does not affect use of coarse residues for [variability testing](/sub-topics/natural-deportment-characterisation). However, it is necessary to establish actual [particle size](https://en.wikipedia.org/wiki/Particle_size) distributions for site specific coarse residues as part of an initial evaluation program in order to select optimal sieve sizes for routine testing. \n \nMass of specific sieve size fractions is also monitored during routine testing before samples are sent for [assay](https://en.wikipedia.org/wiki/Assay)ing to provide a qa/qc flag for samples that show unusual mass distributions that may not be suitable for testing. sieve size selections primary objective is the generation of a minimum number of data points to define a statistically meaningful Response Curve and Ranking. This requires a minimum of three sieve sizes (generating four size fractions) across the cumulative mass range.\n\nSelection of Optimal Sieve Sizes[](#Selection_of_Optimal_Sieve_Sizes)\n=====================================================================\n\nsieve size selection aims to ensure roughly equal masses in each fraction. This provides sufficient coverage on a Response Curve diagram to generate statistical confidence in an eventual [Response Ranking](/sub-topics/natural-deportment-characterisation) and subsequent modelling activities. Ideal mass in each fraction is calculated by 100%/'n' where 'n' is the number of sizes being generated by the testing. \n \nAs an example, if 5 sizes are planned then ideal mass per fraction is ~20%. Some variation around this is normal and expected however if masses deviate substantially from this as shown in the table below then selected size fractions should be adjusted.\n\nsize fraction #\n\nIdeal Mass\n\nFailed Mass qa/qc\n\nPassed Mass qa/qc\n\n1\n\n20%\n\n40%\n\n17%\n\n2\n\n20%\n\n10%\n\n23%\n\n3\n\n20%\n\n20%\n\n18%\n\n4\n\n20%\n\n5%\n\n19%\n\n5\n\n20%\n\n25%\n\n23%\n\nThere is no 'correct' set of sieve sizes or look up function for correct sizes, as long as mass distribution objectives are met then the selection is considered appropriate for those samples. It is recommended that for an initial evaluation (first 20-50 samples) five sieves are used (giving six fractions). This can be reduced to 3 sieves depending on Response Curve variability and consistency of mass fraction data.\n\n[Response Ranking](/sub-topics/natural-deportment-characterisation) (RR)[](#Response_Ranking_RR_)\n=================================================================================================\n\nCRC OREs [Response Ranking](/sub-topics/natural-deportment-characterisation) approach allows results to be systematically and routinely processed and interpreted. This facilitates comparative ranking between deposits and domaining GE within deposits. RR is a mathematical function that can be used as an input into a range of CRC ORE modelling and simulation software environments to determine operational [Grade Engineering](/pages/wikiore-introduction-to-grade-engineering) scenarios and value utilising screening. [Response Ranking](/sub-topics/natural-deportment-characterisation)s are neither related or dependent on head grade, which acts as a modifying attribute. \n \nRR values are independent characteristics and, rather than providing an answer, allow for the calculation of a range of outcomes. They are the [Grade Engineering](/pages/wikiore-introduction-to-grade-engineering) equivalent of processing attributes (Bond work index, A\\*b,SPI etc...). Values by themselves do not indicate what mass pull gives optimum upgrade or what grade categories it should be applied to. These are dynamic operational decisions driven by RR but optimized by operational considerations and economics (more detail on this is available in ((STRATEGIC PLANNING WITH [Grade Engineering](/pages/wikiore-introduction-to-grade-engineering)|Chapter 8))). \n \nWhile this current section focuses on [natural deportment](/pages/wikiore-natural-deportment), the same principles and ranking methodology can be applied to any separation lever as part of [Grade Engineering](/pages/wikiore-introduction-to-grade-engineering) assessments. Comparing RR values for a site against a global comparative database is a key aspect of [Grade Engineering](/pages/wikiore-introduction-to-grade-engineering)® [opportunity assessment](/sub-topics/opportunity-assessments)s. Experience to date indicates when a site presents with RR >~60 at [variability testing](/sub-topics/natural-deportment-characterisation) scale a high baseline opportunity generally exists. \n \nAlthough generating, processing and interpreting this data is relatively straightforward, systematic databases of [grade by size](/pages/wikiore-natural-deportment) data from drill core testing, production scale testing (e.g. [belt cut](/sub-topics/sampling)s or [truck](https://en.wikipedia.org/wiki/Haul_truck)s) or mill surveys, remains rare in the industry. This lack of data means that opportunities are typically overlooked on most operations stressing the importance of undertaking rapid assessment programs. CRC ORE continues to generate a significant centralized database of [grade by size](/pages/wikiore-natural-deportment) data across a range of deposit styles and sample types which can increasingly be used to rank and compare individual sites against a global dataset.\n\n[response factor](/sub-topics/natural-deportment-characterisation)s (RF)[](#response_factors_RF_)\n-------------------------------------------------------------------------------------------------\n\nIn [Grade Engineering](/pages/wikiore-introduction-to-grade-engineering), relative differences between separated fractions and feed grade is referred to as a [response factor](/sub-topics/natural-deportment-characterisation) (RF). RF is a function of rock type and its interaction with separation lever technologies and can be calculated one of two ways:\n\n1. New cumulative grade of undersize material / feed grade of sample\n2. Relative cumulative metal percent / relative cumulative mass percent\n\nAs both calculation methods normalise for starting grade/metal this allows for a standard graph to be produced to compare a set of results, irrespective of feed grade variations. \n \n[response factor](/sub-topics/natural-deportment-characterisation) varies as a function of mass pull, with a small mass retained (10-30%) typically giving a high [response factor](/sub-topics/natural-deportment-characterisation) while a high mass retained (>70%) gives a lower value. This co-dependency between [response factor](/sub-topics/natural-deportment-characterisation) and mass is why CRC ORE identified a need for a standardised method to normalise responses. \n \nAn example of laboratory scale testing for [response factor](/sub-topics/natural-deportment-characterisation)s is shown below. Data points represent actual test laboratory results using crushed drill core at a range of screen sizes.\n\n \n [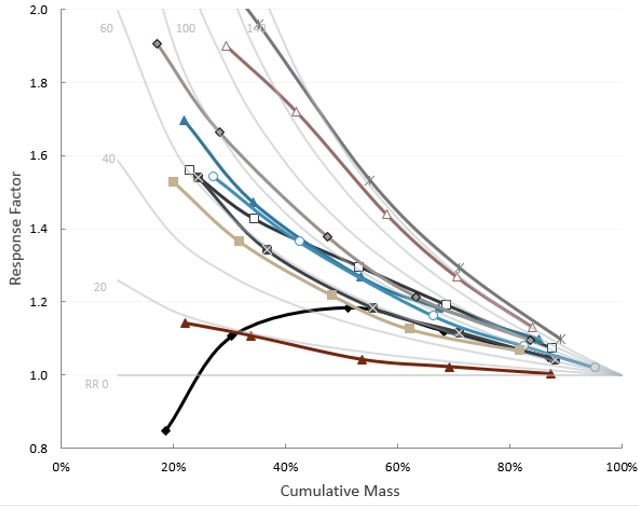](https://res.cloudinary.com/shapeable/image/upload/v1687255689/wikiore/110.jpg) \n\n[response factor](/sub-topics/natural-deportment-characterisation)s have two main properties useful for characterisation. Firstly, there is a maximum theoretical limit for any given mass pull as metal is constrained within the feed sample. This produces a limit of 100%/’m’ where ‘m’ is the cumulative undersize mass. The second useful property defines a no response result. Calculations for this mean that associated metal pulls will always be equal to mass pulls (40% mass = 40% metal, 90% mass = 90% metal etc…). Tabulated results below show both a maximum theoretical |LHS| and a no response |RHS| set of values included associated RF calculations.\n\nMass (%)\n\nMetal (%)\n\nRF\n\n \n\nMass (%)\n\nMetal (%)\n\nRF\n\n100\n\n100\n\n1.00\n\n \n\n100\n\n100\n\n1.00\n\n80\n\n100\n\n1.25\n\n \n\n80\n\n80\n\n1.00\n\n60\n\n100\n\n1.67\n\n \n\n60\n\n60\n\n1.00\n\n40\n\n100\n\n2.50\n\n \n\n40\n\n40\n\n1.00\n\n20\n\n100\n\n5.00\n\n \n\n20\n\n20\n\n1.00\n\nMaximum theoretical responses at a given mass pull can be expressed as RF = m -1, while the no response is expressed as RF = m. This provides a list of potential reference curves utilising the equation RF = m RS where RS is a response score between 0 and 1 (assuming upgrading into finer fractions). These curves, once converted to log/-log space, generate straight lines with their respective slope being defined by RS.\n\n [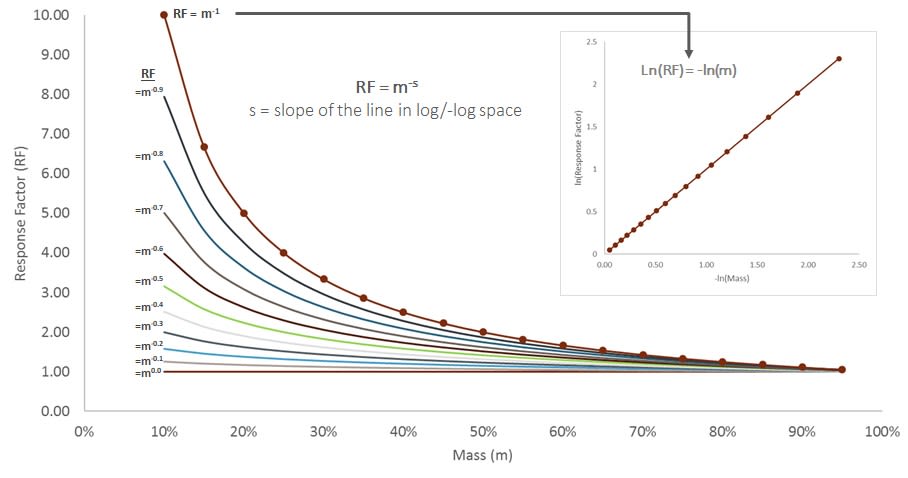](https://res.cloudinary.com/shapeable/image/upload/v1687255691/wikiore/106.jpg) \n\nScaling to Response Ranking[](#Scaling_to_Response_Ranking)\n-----------------------------------------------------------\n\nRR values are calculated by the following equation:\n\n [](https://res.cloudinary.com/shapeable/image/upload/v1687255692/wikiore/111.jpg) \n\nThey are generally scaled from 0-200 with 200 representing a theoretical maximum response. Negative values can be observed, indicating increasing concentration in coarse size fractions, however are not typical. Higher RR values indicate greater potential for separation from a feed material. \n \nRR values are calculated for each individual point within a given [natural deportment](/pages/wikiore-natural-deportment) sample. Resulting average values are then determined along with variations in associated Response Scores to provide a measure of fit to the expected trend. From the example below an average RR value of 68 is produced with an associated [standard deviation](https://en.wikipedia.org/wiki/Standard_deviation) in RS (StDev) of 0.03.\n\nSize\n\nMass (%)\n\nMetal (%)\n\n[response factor](/sub-topics/natural-deportment-characterisation) (RF)\n\nResponse Score (RS)\n\nResponse Rank (RR)\n\n\\>50mm\n\n80\n\n86\n\n1.08\n\n0.32\n\n65\n\n50-19mm\n\n60\n\n70\n\n1.17\n\n0.30\n\n60\n\n19-9.5mm\n\n40\n\n55\n\n1.38\n\n0.35\n\n70\n\n<9.5mm\n\n20\n\n37\n\n1.85\n\n0.38\n\n76\n\n \n[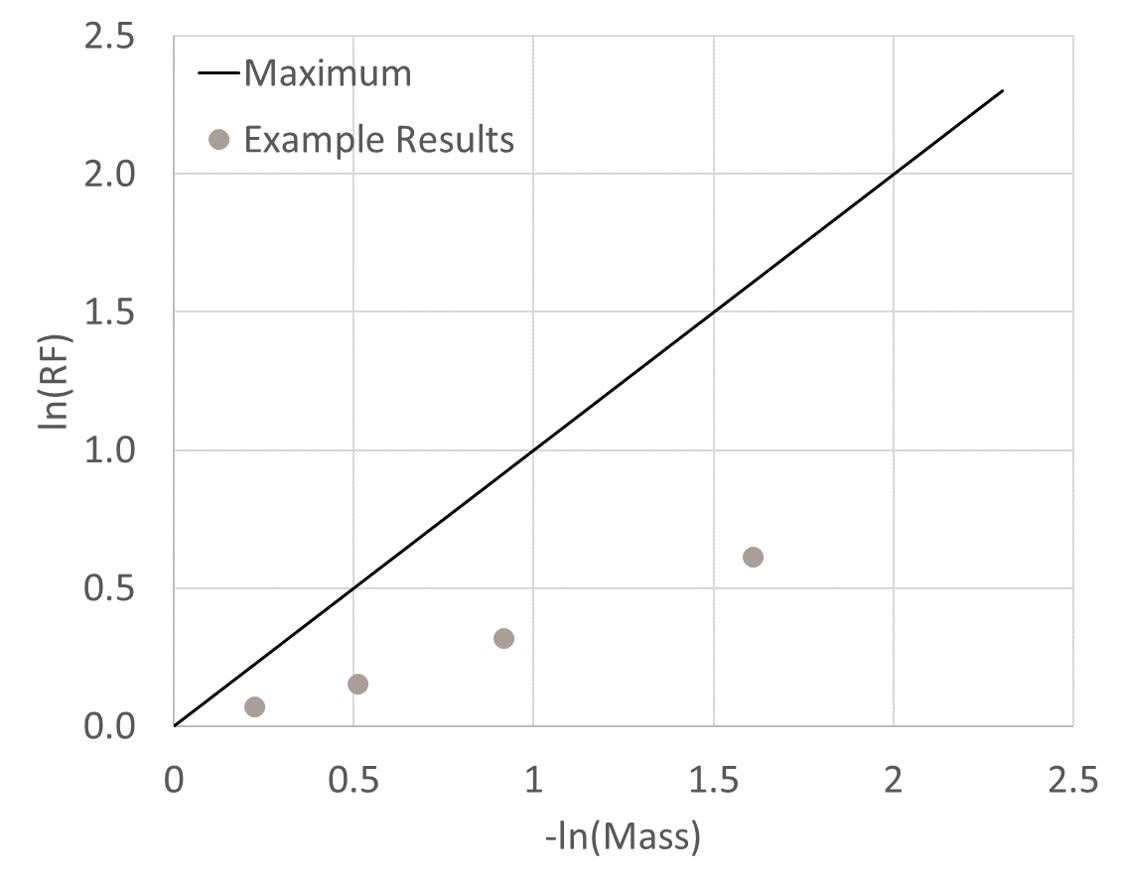](https://res.cloudinary.com/shapeable/image/upload/v1687255694/wikiore/113.jpg)\n\nQA/QC Data Analysis[](#QA_QC_Data_Analysis)\n-------------------------------------------\n\nqa/qc is a measure of curve fit to the mathematical model function which can be expressed as [standard deviation](https://en.wikipedia.org/wiki/Standard_deviation) against the [Response Ranking](/sub-topics/natural-deportment-characterisation). Curve shape and associated response attributes can be displayed using the [grade by size](/pages/wikiore-natural-deportment) Data Viewer. A snapshot of the user interface indicates the key functionalities. Any sample or element in the analytical suite can be selected for visualization. Examples of acceptable and non-acceptable qa/qc results are illustrated below. \n \nIt should be noted that other analytical elements (as proxies for mineralogy) can exhibit different [Response Ranking](/sub-topics/natural-deportment-characterisation)s as a function of different breakage and textural associations coupled with analytical precision. Intra-sample [Response Ranking](/sub-topics/natural-deportment-characterisation) differences between elements become more pronounced when specific elements reflect increasingly diverse mineralogies. As an example Fe can be associated with a wide range of [sulphides](https://en.wikipedia.org/wiki/Sulfide_mineral), oxides, silicates and carbonates. \n \n[Response Ranking](/sub-topics/natural-deportment-characterisation) [standard deviation](https://en.wikipedia.org/wiki/Standard_deviation)s less than 0.05 (10RR units) are considered to be high quality; results between 0.05-0.10 (10-20RR units) are acceptable but are typically individually assessed; whereas values over 0.1 (20RR units) for drill core testing are regarded as failing qa/qc. [standard deviation](https://en.wikipedia.org/wiki/Standard_deviation) plus accurate sieve size selection ensures data points cover the full cumulative mass range and ensures down stream modelling activites are accurate. \n \nIn the example below the sample represented by the black line fails this qa/qc stage due to a significant deviation from the expected trend (this sample has a StDev of 0.18). [Response Ranking](/sub-topics/natural-deportment-characterisation)s that pass qa/qc are used for further analysis as well as to compare and bench mark responses for selected [assay](https://en.wikipedia.org/wiki/Assay) elements and associations.\n\n \n[](https://res.cloudinary.com/shapeable/image/upload/v1687255689/wikiore/110.jpg)\n\n### Negative RR Values[](#Negative_RR_Values)\n\nAlthough typical RR values will range from 0 to 200 there is a subset that can present with negative values. Care is needed when dealing with these as, mathematically, they can technically range to negative infinity. It should be noted that an RR of -1200 is completely valid although highly skewed. Given qa/qc steps such values have increased thresholds to pass as they naturally produce high StDev values. Depending on the specific activity leaving negative results as they are may be valid however in cases such as averaging domains or spatial population they can present with challenges. \n \nTo resolve this issue true negative RR values can be calculated which aim to scale all negative results between -200 and 0. This process involves inverting the standard RR equation to calculate a relative upgrade for mass per metal and then taking this calculated value as the true negative result (equation shown below). An example comparison between the standard RR and true negative RR is highlighted in the following table.\n\n[](https://res.cloudinary.com/shapeable/image/upload/v1687255696/wikiore/163.jpg)\n\nExample\n\nMass%\n\nMetal%\n\nRR\n\nStandard RR\n\n60%\n\n10%\n\n\\-702\n\nTrue Negative RR\n\n60%\n\n10%\n\n\\-156\n\n### Activity 1: RR Calculation[](#Activity_1:_RR_Calculation)\n\nClick [Here](/pages/wikiore-activity-1-natural-deportment) for a practical activity to calculate RR values from grade and mass data\n\nRR Analysis[](#RR_Analysis)\n---------------------------\n\nOnce results have been processed and samples put through qa/qc an initial analysis is conducted to determine any high level controls or links on RR. Note: graphs in the following section were generated using [Reflex's ioGAS software](https://reflexnow.com/product/iogas/) however analysis can be conducted in any package. \n \nGenerally the first stage of any analysis is to evaluate each site domain to determine if a uniform response is present across the entire orebody or if specific rock types/domains respond differently. \n \n[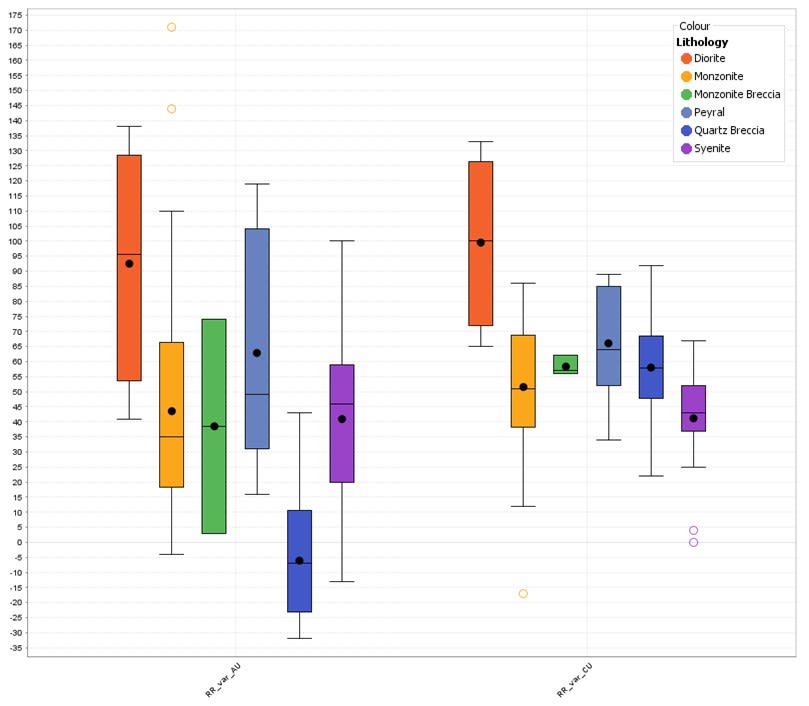](https://res.cloudinary.com/shapeable/image/upload/v1687255698/wikiore/161.jpg) \n \nNext, relationships between each samples individual RRs should be evaluated to define any that present with offset deportment. Meaning as one element upgrades another doesn't, or does so at a different rate. For the [Neytiri](/sub-topics/a-practical-example-of-grade-engineering-evaluation) dataset as both Gold and Copper are present these can be compared. In a [Grade Engineering](/pages/wikiore-introduction-to-grade-engineering) study this should be done for all elements especially including any deleterious elements as this can impact on [Grade Engineering](/pages/wikiore-introduction-to-grade-engineering) application options. \n \n[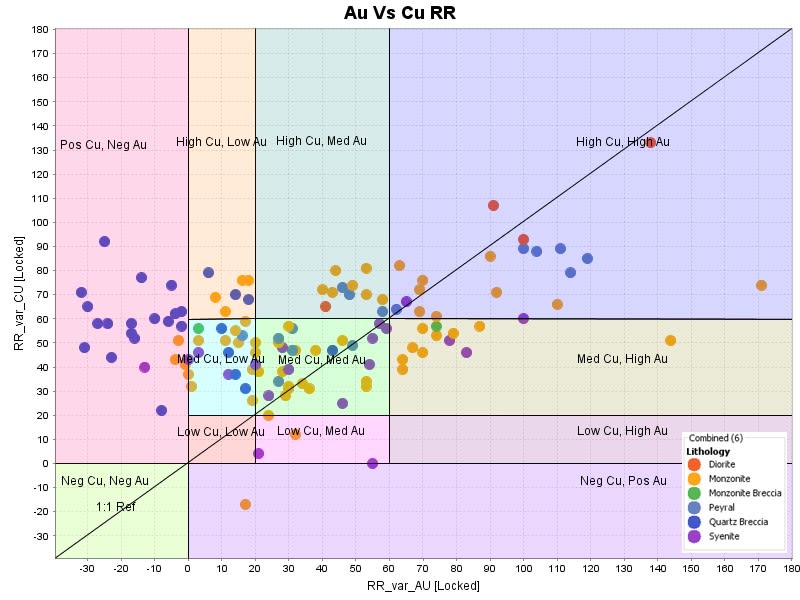](https://res.cloudinary.com/shapeable/image/upload/v1687255699/wikiore/157.jpg) \n \nIn the above figure the 1:1 reference line shows where both elements show identical [natural deportment](/pages/wikiore-natural-deportment) behaviors. Results plotting above this line indicate that Cu is concentrating at a higher rate than Au and vice versa for results below the line. The coloured [Response Ranking](/sub-topics/natural-deportment-characterisation) reference zones can be used to compare and bench mark responses. Based on extensive CRC ORE testing and [Grade Engineering](/pages/wikiore-introduction-to-grade-engineering) assessments across a range of deposits and deposit types, [Response Ranking](/sub-topics/natural-deportment-characterisation)s above 60 for [variability testing](/sub-topics/natural-deportment-characterisation) are considered to show potential for [natural deportment](/pages/wikiore-natural-deportment) as a dominant [Grade Engineering](/pages/wikiore-introduction-to-grade-engineering) value driver. [Response Ranking](/sub-topics/natural-deportment-characterisation)s of 20-60 are considered to indicate that integration of [natural deportment](/pages/wikiore-natural-deportment) with an additional lever such as [differential blasting](/pages/wikiore-induced-deportment) will be required to deliver value. [Response Ranking](/sub-topics/natural-deportment-characterisation)s below 20 are considered to indicate that [natural deportment](/pages/wikiore-natural-deportment) will not be a significant driver. Negative RR values indicate an inversed relationship than expected between size and grade and need to be treated separately. \n \nAny relationships found at this stage of analysis that can discriminate samples falling into these bins should be noted as it will aid in spatial population and downstream predictions. \n \nThis analysis method is useful for tracking mineralogical signatures of [natural deportment](/pages/wikiore-natural-deportment). For example, if significant amounts of pyrite were preferentially deporting by size compared to initial mineralogy of the head sample, it would be expected that the [Response Ranking](/sub-topics/natural-deportment-characterisation) S:Cu ratio would increase. Conversely if high Cu-sulphide phases such as bornite or chalcocite were preferentially deporting then the [Response Ranking](/sub-topics/natural-deportment-characterisation) S:Cu ratio would decrease. \n \nIn the extensive data sets developed in CRC ORE projects to-date, no relationship between head grade and RR has been observed. This reflects the dominant control between association and paragenesis rather than abundance. Although no strong link between head grade and RR has been observed if such a link is ever found at a particular site it will have a profound impact on down streamGE processes. \n \n[Work](/pages/wikiore-p-1-006-geological-controls-on-grade-by-size) is ongoing to determine fundamental geological controls on variable [natural deportment](/pages/wikiore-natural-deportment) responses to develop predictive models. \n \nDiversity of geological control is reflected in significant variability of [Response Ranking](/sub-topics/natural-deportment-characterisation) evident for typical testing programs. It is recommended that for initial assessment of [grade by size](/pages/wikiore-natural-deportment) typically developed using drill core residues; composite sample intervals similar to [metallurgical](https://en.wikipedia.org/wiki/Metallurgy) composites or nominal bench height are used. As an initial assessment a sample selection matrix of different ore types/lithologies, alteration styles and grade classes should be developed until more coherent RR groupings are recognized as discrete domains. This typically involves a minimum of 100 samples to adequately cover a sample selection matrix. As for any [geomet](https://en.wikipedia.org/wiki/Geometallurgy)allurgical style attribute or domaining exercise an extensive sampling and testing program eventually involving thousands of samples, may be required to support domaining in situations of high variability. As the database grows assignment of average RR by geological category is generally undertaken. \n \nFor extensive multi-element data RR’s for individual elements can be comparatively ranked to highlight associations which typically provide information on probable controls. In the case of the mesothermal gold example a very strong correlation between high RR for Au, Bi, Ag and S is evident. In the case of the porphyry Cu example Mo shows high RR while Cu, Zn, Ag, S, Pb and Cu show a closeting of moderate RR. This may indicate that the moderate Cu RR response is related to late stage base metal-bearing veins rather than earlier paragenetic Cu associations in veins or disseminations which are not reporting as preferential [grade by size](/pages/wikiore-natural-deportment) related breakage. \n \nThe [Response Ranking](/sub-topics/natural-deportment-characterisation) approach developed by CRC ORE allows [grade by size](/pages/wikiore-natural-deportment) data to be systematically and routinely processed and interpreted for qa/qc. This facilitates comparative ranking between deposits and definition of variability and domaining within deposits. Comparative ranking is particularly suited for testing of coarse [assay](https://en.wikipedia.org/wiki/Assay) residues where the residues have been generated using a constrained sample preparation and size reduction approach. \n \nAlthough generating [grade by size](/pages/wikiore-natural-deportment) data and more recently processing and interpreting this data is relatively straightforward, systematic databases of [grade by size](/pages/wikiore-natural-deportment) data from drill core testing, production scale testing (e.g. [belt cut](/sub-topics/sampling)s or trucks) or mill surveys, remains rare in the industry. This lack of data means that [grade by size](/pages/wikiore-natural-deportment) opportunity is typically overlooked on most operations stressing the importance of undertaking rapid assessment programs. CRC ORE continues to generate a significant centralized database of [grade by size](/pages/wikiore-natural-deportment) data across a range of deposit styles and sample types which can increasingly be used to rank and compare individual sites against a global dataset. [Response Ranking](/sub-topics/natural-deportment-characterisation)s above 60 for drill core scale testing indicate potential for [grade by size](/pages/wikiore-natural-deportment) to be considered as a dominant [Grade Engineering](/pages/wikiore-introduction-to-grade-engineering) value driver. \n \n[Response Ranking](/sub-topics/natural-deportment-characterisation)s are mathematical functions that can be used as inputs into a range of CRC ORE modelling and simulation software to determine operational [Grade Engineering](/pages/wikiore-introduction-to-grade-engineering) scenarios and value. [Response Ranking](/sub-topics/natural-deportment-characterisation)s are not related to or dependent on head grade, which acts as a modifying attribute. The higher the RR the higher the potential to use [grade by size](/pages/wikiore-natural-deportment) and resulting screening to separate new accept and reject type #feed streams. RR by itself does not indicate what mass pull gives optimum upgrade or what grade categories it should be applied to. These are dynamic operational decisions driven by RR but optimized by operational considerations and economics.\n\n \nDownload the RR data used in this analysis [ ](https://res.cloudinary.com/shapeable/raw/upload/v1687303408/wikiore/357.php)[Neytiri RR data](https://res.cloudinary.com/shapeable/raw/upload/v1687303408/wikiore/357.php)\n\nWorkflow for Natural Deportment Characterisation[](#Workflow_for_Natural_Deportment_Characterisation)\n-----------------------------------------------------------------------------------------------------\n\n [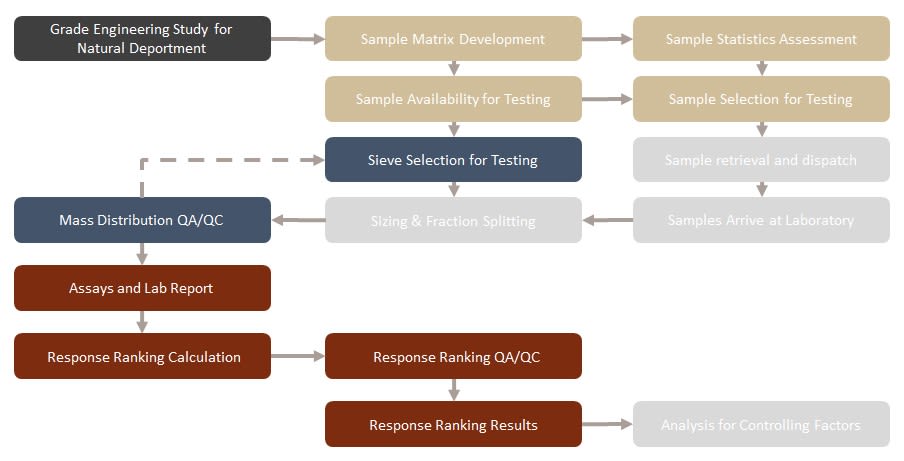](https://res.cloudinary.com/shapeable/image/upload/v1687303115/wikiore/108.jpg) \n\nDomaining Variability Responses[](#Domaining_Variability_Responses)\n===================================================================\n\nOnce analysis has been completed this information passed on for population into the [Grade Engineering](/pages/wikiore-introduction-to-grade-engineering) [block model](https://en.wikipedia.org/wiki/Mineral_resource_estimation#Resource_block_model). More detail on specific methodologies used for this can be found [here](/sub-topics/spatial-population).\n\nProduction [Scale-Up](Scale-Up)[](#Production_Scale-Up)\n-------------------------------------------------------\n\nPrevious CRC ORE studies have observed a relatively consistent increase in [Response Ranking](/sub-topics/natural-deportment-characterisation)s when moving from drill core [variability testing](/sub-topics/natural-deportment-characterisation) scale to production scale. This difference is usually accounted for in what is referred to as a “[scale-up](/sub-topics/natural-deportment-characterisation) Factor”. This is applied across all drill core test results to bring them into line with expected production scale responses. Studies to date have found two common [scale-up](/sub-topics/natural-deportment-characterisation) Factors; the first at approximately x1.20 and a second at x1.60. This has been observed to vary both across and within a given site. \n \nCRC ORE has observed only a single case where production scale responses were lower than those measured at drill core scale ([scale-up](/sub-topics/natural-deportment-characterisation) Factor = x0.50).\n\n \nExample of normal [scale-up](/sub-topics/natural-deportment-characterisation) relationship between drill core (red) and bulk samples (blue).\n\n [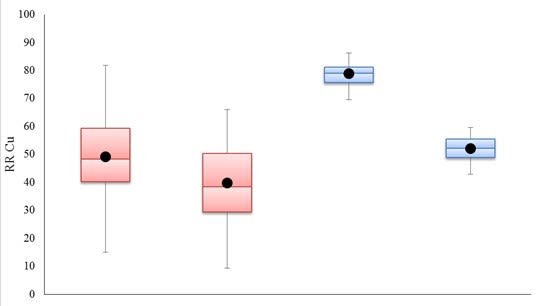](https://res.cloudinary.com/shapeable/image/upload/v1687303116/wikiore/109.jpg) \n\n[Bulk testing](/sub-topics/sampling)[](#Bulk_testing)\n=====================================================\n\n[bulk testing](/sub-topics/sampling) is critical in determining both production scale responses and associated [scale-up](/sub-topics/natural-deportment-characterisation) factors for drill core results. Ideally ROM or post [primary crusher](https://en.wikipedia.org/wiki/Crusher) material should be sampled and evaluated using the exact same protocols as [variability testing](/sub-topics/natural-deportment-characterisation) to determine; ideal sizes, grades, [response factor](/sub-topics/natural-deportment-characterisation)s and [Response Ranking](/sub-topics/natural-deportment-characterisation)s. \n \nMore detail on how to effectively sample bulk material is found [here.](/sub-topics/sampling)\n\nProduction Trials[](#Production_Trials)\n=======================================\n\nDetails on conducting Production Trials can be found here: [Site Trials](https://wikiore.com.au/Site Trials)\n\n \n \n\n* * *\n\n* * *\n\n[Previous Section: Methods](/sub-topics/methods) | (([Induced deportment](/pages/wikiore-induced-deportment) Characterisation|Next Section: [Induced deportment](/pages/wikiore-induced-deportment) Characterisation))"},"options":{"id":"65d2edb6ebf7bb9388ffb014_options","text":""},"intro":{"id":"65d2edb6ebf7bb9388ffb014_intro","plain":"","text":""},"outro":{"id":"65d2edb6ebf7bb9388ffb014_outro","text":""},"themeMode":null,"bannerThemeMode":null,"orderNumber":null,"openGraph":{"title":null,"description":{"plain":"Introduction\nnatural deportment laboratory testing aims to determine if specific assay elements (as a proxy for mineralogy) are preferentially deporting by size. Typically expressed as a systematic increase in concentration in finer size fractions. \nassays from a series of size fractions for each sample are used to generate Response Curves. A mathematical function is then calculated across individual curves to generate a Response Ranking (RR) - a single number used to describe the magnitude of a Response Curve. Response Rankings are used as inputs into Grade Engineering block models, process simulations and economic evaluations. \nTesting can be carried out at drill core, blast hole chip or ROM scale although transforms are required to compare different scales. drill core testing is referred to as 'variability testing'. Testing of material at ROM scale is referred to as 'bulk testing', up to and including Production Trials. Depending on opportunity assessment requirements and site considerations a selection will be made regarding an appropriate sample type to test. \nTesting programs are conducted in two stages:\n\nAn initial evaluation phase to select size fractions that generate optimal mass distributions typically involving 5-6 size fractions, and\nRoutine testing based on a smaller number of size fractions (typically four) selected based on stage 1 mass results.\n\nvariability testing\nvariability testing can be carried out using coarse residues generated by crushing during routine laboratory assay preparation as a precursor to pulverisation. Many projects/sites routinely store coarse residues specifically for future testing or check assaying. In this case stored coarse residues can be used for cost effective testing. Stored pulps are not suitable for variability testing as material has undergone excessive breakage and natural deportment signatures have been lost. \ncrushing protocols for coarse residues vary between sites and companies. These residues are produced with the aim to reduce the top size of a particle size distribution to a statistically suitable point for accurately splitting a portion to be used for fine pulverising prior to chemical assaying. A typical top size for coarse residues is 99% passing -3.35mm or the equivalent #6 mesh (occasionally referred to as 80% passing 2mm). \nparticle size distributions are a function of crusher gap settings, drill core sizes and rock hardness. Crusher gap settings in particular can vary between laboratories or drift over time. Within limits this variability does not affect use of coarse residues for variability testing. However, it is necessary to establish actual particle size distributions for site specific coarse residues as part of an initial evaluation program in order to select optimal sieve sizes for routine testing. \nMass of specific sieve size fractions is also monitored during routine testing before samples are sent for assaying to provide a qa/qc flag for samples that show unusual mass distributions that may not be suitable for testing. sieve size selections primary objective is the generation of a minimum number of data points to define a statistically meaningful Response Curve and Ranking. This requires a minimum of three sieve sizes (generating four size fractions) across the cumulative mass range.\nSelection of Optimal Sieve Sizes\nsieve size selection aims to ensure roughly equal masses in each fraction. This provides sufficient coverage on a Response Curve diagram to generate statistical confidence in an eventual Response Ranking and subsequent modelling activities. Ideal mass in each fraction is calculated by 100%/'n' where 'n' is the number of sizes being generated by the testing. \nAs an example, if 5 sizes are planned then ideal mass per fraction is ~20%. Some variation around this is normal and expected however if masses deviate substantially from this as shown in the table below then selected size fractions should be adjusted.\nsize fraction #\nIdeal Mass\nFailed Mass qa/qc\nPassed Mass qa/qc\n1\n20%\n40%\n17%\n2\n20%\n10%\n23%\n3\n20%\n20%\n18%\n4\n20%\n5%\n19%\n5\n20%\n25%\n23%\nThere is no 'correct' set of sieve sizes or look up function for correct sizes, as long as mass distribution objectives are met then the selection is considered appropriate for those samples. It is recommended that for an initial evaluation (first 20-50 samples) five sieves are used (giving six fractions). This can be reduced to 3 sieves depending on Response Curve variability and consistency of mass fraction data.\nResponse Ranking (RR)\nCRC OREs Response Ranking approach allows results to be systematically and routinely processed and interpreted. This facilitates comparative ranking between deposits and domaining GE within deposits. RR is a mathematical function that can be used as an input into a range of CRC ORE modelling and simulation software environments to determine operational Grade Engineering scenarios and value utilising screening. Response Rankings are neither related or dependent on head grade, which acts as a modifying attribute. \nRR values are independent characteristics and, rather than providing an answer, allow for the calculation of a range of outcomes. They are the Grade Engineering equivalent of processing attributes (Bond work index, A*b,SPI etc...). Values by themselves do not indicate what mass pull gives optimum upgrade or what grade categories it should be applied to. These are dynamic operational decisions driven by RR but optimized by operational considerations and economics (more detail on this is available in ((STRATEGIC PLANNING WITH Grade Engineering|Chapter 8))). \nWhile this current section focuses on natural deportment, the same principles and ranking methodology can be applied to any separation lever as part of Grade Engineering assessments. Comparing RR values for a site against a global comparative database is a key aspect of Grade Engineering® opportunity assessments. Experience to date indicates when a site presents with RR >~60 at variability testing scale a high baseline opportunity generally exists. \nAlthough generating, processing and interpreting this data is relatively straightforward, systematic databases of grade by size data from drill core testing, production scale testing (e.g. belt cuts or trucks) or mill surveys, remains rare in the industry. This lack of data means that opportunities are typically overlooked on most operations stressing the importance of undertaking rapid assessment programs. CRC ORE continues to generate a significant centralized database of grade by size data across a range of deposit styles and sample types which can increasingly be used to rank and compare individual sites against a global dataset.\nresponse factors (RF)\nIn Grade Engineering, relative differences between separated fractions and feed grade is referred to as a response factor (RF). RF is a function of rock type and its interaction with separation lever technologies and can be calculated one of two ways:\n\nNew cumulative grade of undersize material / feed grade of sample\nRelative cumulative metal percent / relative cumulative mass percent\n\nAs both calculation methods normalise for starting grade/metal this allows for a standard graph to be produced to compare a set of results, irrespective of feed grade variations. \nresponse factor varies as a function of mass pull, with a small mass retained (10-30%) typically giving a high response factor while a high mass retained (>70%) gives a lower value. This co-dependency between response factor and mass is why CRC ORE identified a need for a standardised method to normalise responses. \nAn example of laboratory scale testing for response factors is shown below. Data points represent actual test laboratory results using crushed drill core at a range of screen sizes.\n \nresponse factors have two main properties useful for characterisation. Firstly, there is a maximum theoretical limit for any given mass pull as metal is constrained within the feed sample. This produces a limit of 100%/’m’ where ‘m’ is the cumulative undersize mass. The second useful property defines a no response result. Calculations for this mean that associated metal pulls will always be equal to mass pulls (40% mass = 40% metal, 90% mass = 90% metal etc…). Tabulated results below show both a maximum theoretical |LHS| and a no response |RHS| set of values included associated RF calculations.\nMass (%)\nMetal (%)\nRF\nMass (%)\nMetal (%)\nRF\n100\n100\n1.00\n100\n100\n1.00\n80\n100\n1.25\n80\n80\n1.00\n60\n100\n1.67\n60\n60\n1.00\n40\n100\n2.50\n40\n40\n1.00\n20\n100\n5.00\n20\n20\n1.00\nMaximum theoretical responses at a given mass pull can be expressed as RF = m -1, while the no response is expressed as RF = m. This provides a list of potential reference curves utilising the equation RF = m RS where RS is a response score between 0 and 1 (assuming upgrading into finer fractions). These curves, once converted to log/-log space, generate straight lines with their respective slope being defined by RS.\n \nScaling to Response Ranking\nRR values are calculated by the following equation:\n \nThey are generally scaled from 0-200 with 200 representing a theoretical maximum response. Negative values can be observed, indicating increasing concentration in coarse size fractions, however are not typical. Higher RR values indicate greater potential for separation from a feed material. \nRR values are calculated for each individual point within a given natural deportment sample. Resulting average values are then determined along with variations in associated Response Scores to provide a measure of fit to the expected trend. From the example below an average RR value of 68 is produced with an associated standard deviation in RS (StDev) of 0.03.\nSize\nMass (%)\nMetal (%)\nresponse factor (RF)\nResponse Score (RS)\nResponse Rank (RR)\n>50mm\n80\n86\n1.08\n0.32\n65\n50-19mm\n60\n70\n1.17\n0.30\n60\n19-9.5mm\n40\n55\n1.38\n0.35\n70\n<9.5mm\n20\n37\n1.85\n0.38\n76\n\nQA/QC Data Analysis\nqa/qc is a measure of curve fit to the mathematical model function which can be expressed as standard deviation against the Response Ranking. Curve shape and associated response attributes can be displayed using the grade by size Data Viewer. A snapshot of the user interface indicates the key functionalities. Any sample or element in the analytical suite can be selected for visualization. Examples of acceptable and non-acceptable qa/qc results are illustrated below. \nIt should be noted that other analytical elements (as proxies for mineralogy) can exhibit different Response Rankings as a function of different breakage and textural associations coupled with analytical precision. Intra-sample Response Ranking differences between elements become more pronounced when specific elements reflect increasingly diverse mineralogies. As an example Fe can be associated with a wide range of sulphides, oxides, silicates and carbonates. \nResponse Ranking standard deviations less than 0.05 (10RR units) are considered to be high quality; results between 0.05-0.10 (10-20RR units) are acceptable but are typically individually assessed; whereas values over 0.1 (20RR units) for drill core testing are regarded as failing qa/qc. standard deviation plus accurate sieve size selection ensures data points cover the full cumulative mass range and ensures down stream modelling activites are accurate. \nIn the example below the sample represented by the black line fails this qa/qc stage due to a significant deviation from the expected trend (this sample has a StDev of 0.18). Response Rankings that pass qa/qc are used for further analysis as well as to compare and bench mark responses for selected assay elements and associations.\n\nNegative RR Values\nAlthough typical RR values will range from 0 to 200 there is a subset that can present with negative values. Care is needed when dealing with these as, mathematically, they can technically range to negative infinity. It should be noted that an RR of -1200 is completely valid although highly skewed. Given qa/qc steps such values have increased thresholds to pass as they naturally produce high StDev values. Depending on the specific activity leaving negative results as they are may be valid however in cases such as averaging domains or spatial population they can present with challenges. \nTo resolve this issue true negative RR values can be calculated which aim to scale all negative results between -200 and 0. This process involves inverting the standard RR equation to calculate a relative upgrade for mass per metal and then taking this calculated value as the true negative result (equation shown below). An example comparison between the standard RR and true negative RR is highlighted in the following table.\n\nExample\nMass%\nMetal%\nRR\nStandard RR\n60%\n10%\n-702\nTrue Negative RR\n60%\n10%\n-156\nActivity 1: RR Calculation\nClick Here for a practical activity to calculate RR values from grade and mass data\nRR Analysis\nOnce results have been processed and samples put through qa/qc an initial analysis is conducted to determine any high level controls or links on RR. Note: graphs in the following section were generated using Reflex's ioGAS software however analysis can be conducted in any package. \nGenerally the first stage of any analysis is to evaluate each site domain to determine if a uniform response is present across the entire orebody or if specific rock types/domains respond differently. \n \nNext, relationships between each samples individual RRs should be evaluated to define any that present with offset deportment. Meaning as one element upgrades another doesn't, or does so at a different rate. For the Neytiri dataset as both Gold and Copper are present these can be compared. In a Grade Engineering study this should be done for all elements especially including any deleterious elements as this can impact on Grade Engineering application options. \n \nIn the above figure the 1:1 reference line shows where both elements show identical natural deportment behaviors. Results plotting above this line indicate that Cu is concentrating at a higher rate than Au and vice versa for results below the line. The coloured Response Ranking reference zones can be used to compare and bench mark responses. Based on extensive CRC ORE testing and Grade Engineering assessments across a range of deposits and deposit types, Response Rankings above 60 for variability testing are considered to show potential for natural deportment as a dominant Grade Engineering value driver. Response Rankings of 20-60 are considered to indicate that integration of natural deportment with an additional lever such as differential blasting will be required to deliver value. Response Rankings below 20 are considered to indicate that natural deportment will not be a significant driver. Negative RR values indicate an inversed relationship than expected between size and grade and need to be treated separately. \nAny relationships found at this stage of analysis that can discriminate samples falling into these bins should be noted as it will aid in spatial population and downstream predictions. \nThis analysis method is useful for tracking mineralogical signatures of natural deportment. For example, if significant amounts of pyrite were preferentially deporting by size compared to initial mineralogy of the head sample, it would be expected that the Response Ranking S:Cu ratio would increase. Conversely if high Cu-sulphide phases such as bornite or chalcocite were preferentially deporting then the Response Ranking S:Cu ratio would decrease. \nIn the extensive data sets developed in CRC ORE projects to-date, no relationship between head grade and RR has been observed. This reflects the dominant control between association and paragenesis rather than abundance. Although no strong link between head grade and RR has been observed if such a link is ever found at a particular site it will have a profound impact on down streamGE processes. \nWork is ongoing to determine fundamental geological controls on variable natural deportment responses to develop predictive models. \nDiversity of geological control is reflected in significant variability of Response Ranking evident for typical testing programs. It is recommended that for initial assessment of grade by size typically developed using drill core residues; composite sample intervals similar to metallurgical composites or nominal bench height are used. As an initial assessment a sample selection matrix of different ore types/lithologies, alteration styles and grade classes should be developed until more coherent RR groupings are recognized as discrete domains. This typically involves a minimum of 100 samples to adequately cover a sample selection matrix. As for any geometallurgical style attribute or domaining exercise an extensive sampling and testing program eventually involving thousands of samples, may be required to support domaining in situations of high variability. As the database grows assignment of average RR by geological category is generally undertaken. \nFor extensive multi-element data RR’s for individual elements can be comparatively ranked to highlight associations which typically provide information on probable controls. In the case of the mesothermal gold example a very strong correlation between high RR for Au, Bi, Ag and S is evident. In the case of the porphyry Cu example Mo shows high RR while Cu, Zn, Ag, S, Pb and Cu show a closeting of moderate RR. This may indicate that the moderate Cu RR response is related to late stage base metal-bearing veins rather than earlier paragenetic Cu associations in veins or disseminations which are not reporting as preferential grade by size related breakage. \nThe Response Ranking approach developed by CRC ORE allows grade by size data to be systematically and routinely processed and interpreted for qa/qc. This facilitates comparative ranking between deposits and definition of variability and domaining within deposits. Comparative ranking is particularly suited for testing of coarse assay residues where the residues have been generated using a constrained sample preparation and size reduction approach. \nAlthough generating grade by size data and more recently processing and interpreting this data is relatively straightforward, systematic databases of grade by size data from drill core testing, production scale testing (e.g. belt cuts or trucks) or mill surveys, remains rare in the industry. This lack of data means that grade by size opportunity is typically overlooked on most operations stressing the importance of undertaking rapid assessment programs. CRC ORE continues to generate a significant centralized database of grade by size data across a range of deposit styles and sample types which can increasingly be used to rank and compare individual sites against a global dataset. Response Rankings above 60 for drill core scale testing indicate potential for grade by size to be considered as a dominant Grade Engineering value driver. \nResponse Rankings are mathematical functions that can be used as inputs into a range of CRC ORE modelling and simulation software to determine operational Grade Engineering scenarios and value. Response Rankings are not related to or dependent on head grade, which acts as a modifying attribute. The higher the RR the higher the potential to use grade by size and resulting screening to separate new accept and reject type #feed streams. RR by itself does not indicate what mass pull gives optimum upgrade or what grade categories it should be applied to. These are dynamic operational decisions driven by RR but optimized by operational considerations and economics.\nDownload the RR data used in this analysis Neytiri RR data\nWorkflow for Natural Deportment Characterisation\n \nDomaining Variability Responses\nOnce analysis has been completed this information passed on for population into the Grade Engineering block model. More detail on specific methodologies used for this can be found here.\nProduction Scale-Up\nPrevious CRC ORE studies have observed a relatively consistent increase in Response Rankings when moving from drill core variability testing scale to production scale. This difference is usually accounted for in what is referred to as a “scale-up Factor”. This is applied across all drill core test results to bring them into line with expected production scale responses. Studies to date have found two common scale-up Factors; the first at approximately x1.20 and a second at x1.60. This has been observed to vary both across and within a given site. \nCRC ORE has observed only a single case where production scale responses were lower than those measured at drill core scale (scale-up Factor = x0.50).\nExample of normal scale-up relationship between drill core (red) and bulk samples (blue).\n \nBulk testing\nbulk testing is critical in determining both production scale responses and associated scale-up factors for drill core results. Ideally ROM or post primary crusher material should be sampled and evaluated using the exact same protocols as variability testing to determine; ideal sizes, grades, response factors and Response Rankings. \nMore detail on how to effectively sample bulk material is found here.\nProduction Trials\nDetails on conducting Production Trials can be found here: [Site Trials](https://wikiore.com.au/Site Trials)\n\n\nPrevious Section: Methods | ((Induced deportment Characterisation|Next Section: Induced deportment Characterisation))\n"},"image":null},"banners":[],"layout":{"id":"65d2edb7ebf7bb9388ffb04d","name":"Theme Supporting Info","slug":"theme-supporting-info","component":"PageLayoutThemeSupportingInfo"},"videos":[],"imageAssets":[],"people":[],"embeds":{"citations":[],"pages":[{"id":"65d2edb6ebf7bb9388ffb012","name":"Natural Deportment","slug":"wikiore-natural-deportment","path":"/appendices/wikiore-natural-deportment","openGraph":{"title":null,"description":{"plain":"Natural Deportment | Induced Deportment | Bulk Sorting | Particle Sorting | Gravity Separation\n\nnatural deportment is the propensity for some ores to exhibit preferential breakage leading to concentration of minerals into specific size fraction s. This typically involves an increase of valuable mineral phases in finer size fractions, however has occassionally been observed in the coarser fraction under certain geological settings. The geology and mineral association of base and precious metal deposits is typically complex with many overprinting paragenetic events contributing to the creation of potentially mineable reserves.This is evident in features such as multiple vein events; different mineral associations and intergrowths; varying alteration styles and mineralogy’s; metamorphic overprints; banding; discrete lenses and replacement textures.\n\n“This occurs when crack branching occurs more frequently in one of the mineral phases.\nThe most obvious manifestation of preferential breakage is a variation of average composition with particle size in the particle populations. This is often noticed in practice and is easy to detect and measure.”\nR. P. King - Modelling and Simulation of Mineral Processing Systems 2001\n\nNatural Deportment is an interaction function of these rock mass properties, texture, ore paragenesis and mineralogy at a range of scales. There is typically no relationship between magnitude of response and head grade, with the main control being textural rather than absolute abundance. Physical separation is a function of screening employed after blasting or primary crushing. Testing involves screening or sieving of a particle size distribution resulting from sampling production scale blasting (+/-primary crushing) material, or from crushing drillcore using a defined protocol. Sampling and testing protocols are generally readily capable of being completed by most onsite laboratories, or any commercial laboratory of a sites preference.\nFor Characterisation methods for Natural Deportment click HERE.\n"},"image":null}},{"id":"65d2edb6ebf7bb9388ffb010","name":"Introduction to Grade Engineering","slug":"wikiore-introduction-to-grade-engineering","path":"/appendices/wikiore-introduction-to-grade-engineering","openGraph":{"title":null,"description":{"plain":"\nA focus on throughput as the main driver of revenue has led to a bulk average mentality with respect to In-situ cut-off grades. In many cases average grades used to define bench or stope scale processing destination decisions such as mill, dump leach, waste, etc. include significant sub-volumes of material outside cut-off specifications. An averaging approach ignores potentially exploitable grade heterogeneity below the scale of minimum mining unit even though significant localised grade heterogeneity is a dominant characteristic of many base and metal deposit styles and ore types.\nLocalised grade heterogeneity is typically overlooked in favor of maximising extraction rates and loading efficiency. This is coupled with a desire to blend ROM and produce steady state feed in terms of grade and physical properties to optimise and maximise recovery of saleable product particularly in crush-grind-float operations. Where blended supply of ‘averaged’ feed struggles to achieve steady state processing stability, this is a first order indication that significant heterogeneity exists within a resource that could be exploited rather than suppressed.\nGrade Engineering® recognises that in many cases out of specification sub-volumes assigned to destinations based on bulk averages can be removed using efficient coarse separation techniques in the ‘dig and deliver’ interface. coarse separation (~10-100mm) can be used on a range of particle size distributions ranging from ROM to SAG discharge. The earlier this occurs in the conventional dig and deliver mining cycle the higher the potential net value of removing uneconomic material.\nEvery handling and size transformation interface in the dig and deliver cycle should be considered an opportunity for applying coarse separation. ROM and post primary crushing are obvious intervention points with opportunity for separation conditioning during modified blast design. The decision to intervene is a function of grade heterogeneity in a given parcel of material; the yield-response of a separation device at a specific size reduction point; the ability to change a destination decision for one or more of the new streams following separation; and the net value of the new streams after handling costs.\nGrade Engineering® outcomes do not create ‘new’ metal but rather exchange metal from separated components between existing destinations to create improved net value after cost of exchange is considered. This involves exchanging a component of separated mill feed with other destinations such as mineralised waste, stockpiles or dump leach with low recovery. The aim is to bring metal forward from destinations that are not delivering maximum current value.\nOverall metal exchange balance can be modified to suit operational modes or bottlenecks. This can include keeping the concentrator full with improved grades or deferring the need for expanding installed capacity. mass pull on separation devices can be used to control accept/reject tonnages and resulting upgrades. While Grade Engineering® does not create ‘new metal’, outcomes improve resource to reserve conversion by potentially separating economic parcels of ore from mineralised waste.\nThe concept of coarse separation or pre-concentration is not new and has been practiced from the beginning of mining as hand picking. The propensity of some ores to break preferentially during blasting and crushing leading to an increase of valuable phases in finer fractions has also been widely known but rarely exploited at production scale . A notable exception was pre-concentration carried out in the 1980’s at the Bougainville Copper Limited Panguna Cu-Au mine in Papua New Guinea. This involved a screening plant to upgrade marginal low grade ROM ores (0.22 Cu, 0.18 g/t Au) that exhibited preferential grade deportment into fines . The plant had a capacity of 35 Mt p.a. at a <32mm screening size, which produced a 50% Cu-Au upgrade in 38% retained mass.\nAdditional examples of production scale pre-concentration include the Dense Media Plant at Mount Isa Mines which removes ~35% of coarse and hardest Pb-Zn feed before the fine grinding treatment process. This increases throughput , reduces capital intensity in the comminution circuit , and reduces energy requirement per unit metal in the concentrator by >40%, together with a 15% improvement of grade in the retained stream.\nWhile application of sensor-based sorting has found widespread application in industrial recycling and food quality management, there are limited examples of routine application to pre-concentration in the minerals industry . An exception is the Mittersill tungsten mine in Austria where in response to head grades falling from 0.7% to 0.2% since mining commenced in 1976, X-ray Transmission sensor-based particle sorting units were installed in 2008. The results significantly increased effective head grade and reduced energy intensity while allowing rejected waste to be sold as road aggregate.\nAlthough there are global examples of coarse pre-concentration generating value for some base and precious metal mining operations, there is no coherent system-based industry approach or standard methodology to assess optimal configurations for selecting specific technologies or equipment to deliver maximum value for specific ores and operational constraints.\nGrade Engineering® is the first large-scale initiative to focus on integrated methodologies to deliver maximum operational value. The prime aim for CRC ORE is to deliver Grade Engineering® as an industry standard methodology designed to improve productivity and value to mining operations which includes the ability to filter and rank individual operations for highest opportunity.\nGrade Engineering consists of five key technology/technique levers;\nNatural Deportment | Induced Deportment | Bulk Sorting | Particle Sorting | Gravity Separation\n\nEach lever naturally integrates with the mining value chain at one or more points. Some levers can be competitive while others complementary.\nOne such example of complementary levers is the integration of Particle Sorting with Natural Deportment, referred to as Integrated Screening and Particle Sorting (ISPS) within CRC ORE.\n\n\nReturn to Homepage\n"},"image":null}},{"id":"65d2edb6ebf7bb9388ffaff3","name":"Activity 1: Natural Deportment","slug":"wikiore-activity-1-natural-deportment","path":"/appendices/wikiore-activity-1-natural-deportment","openGraph":{"title":null,"description":{"plain":"This activity covers the practical application of Natural Deportment characterisation concepts to lab/site based raw data to generate Response Rankings (RR) for a set of samples. Complete the supplied table to calculate a Response Ranking (RR) and Standard Deviation for each sample from the supplied assays and masses.\n\nActivity 1 Notes:\n\nCalculating sample grade: sum the product of all masses and grades and divide this by total mass\nMass and Metal Percents are calculated relative to the feed material\nMass% = fraction mass / feed mass\nMetal% = (fraction grade x fraction mass) / (feed grade x feed mass)\n\n\nCumulative values are calculated from the finest size up\nThe Response Factor (RF) for this table is calculated from cumulative metal over cumulative mass\n\nSample Response Rankings are calculated by the average\nStandard deviations can be calculated in excel using the '=STDEV()' function\n\n"},"image":null}},{"id":"65d2edb6ebf7bb9388ffb00d","name":"Induced Deportment","slug":"wikiore-induced-deportment","path":"/appendices/wikiore-induced-deportment","openGraph":{"title":null,"description":{"plain":"Natural Deportment | Induced Deportment | Bulk Sorting | Particle Sorting | Gravity Separation\nInduced deportment is the ability to condition sub-volumes of feed material separately through careful application of energy. differential blasting involves conditioning sub-volumes of material at bench or stope scale using customised blast designs that generate imposed size distributions with higher grade concentrated in finer fractions. amenability is a function of heterogeneity at bench hole scale linked to the ability to impose and control different energy distributions within a blast design. As with natural deportment, separation is achieved via screening of post-blast material.\nFor Characterisation methods for Induced Deportment click HERE.\n \n\n"},"image":null}},{"id":"65d2edb6ebf7bb9388ffb019","name":"P1-006 Geological Controls on Grade by Size","slug":"wikiore-p-1-006-geological-controls-on-grade-by-size","path":"/appendices/wikiore-p-1-006-geological-controls-on-grade-by-size","openGraph":{"title":null,"description":{"plain":" \n"},"image":null}}],"people":[],"imageAssets":[],"posts":[]},"parent":{"__typename":"Platform_Page","id":"65d2edb6ebf7bb9388ffaff8","name":"Appendices","path":"/appendices","slug":"appendices","title":null,"subtitle":null,"pretitle":null,"content":{"text":""},"children":[{"__typename":"Platform_Page","id":"65d2edb6ebf7bb9388ffaff4","name":"Activity 2: Induced Deportment","path":"/appendices/wikiore-activity-2-induced-deportment","slug":"wikiore-activity-2-induced-deportment","title":null,"subtitle":null,"pretitle":null,"openGraph":{"description":{"text":"This activity covers the practical calculation of Differential Blasting potential from raw bench scale grade data. Utilising the supplied fragmentation curves and grade tonnage bins calculate potential screen upgrades using a 50mm screen size. Determine the best decision (in terms of final screen upgrade) of which grade bins should receive which energy.\n\n* * *\n\n**Activity 2 Notes:**\n\n* Given no Natural Deportment mass percent will equal metal percent before screening\n* Metal units = grade x tonnes, and is a useful measure for applying metal percents\n * Calculate stream grades by reversing this, metal units / tonnes = grade\n* Overall screen outcomes will be based on compositing all utilised material streams\n * e.g. high energy oversize plus low energy oversize\n * Your screen O/S+U/S must always equal the blast total\n* There are three potential outcomes from this activity;\n * 1\\. Only the waste material receives low energy, all others are high energy\n * 2\\. Only the high grade receives high energy, all others are low energy\n * 3\\. Waste and low grade receive low energy, med and high grade receive high energy\n* To accurately compare upgrades from these three outcomes you will need to normalise out the mass aspect (building on Activity 1)\n\n* * *\n\n[Click here to return to Induced Deportment Characterisation](/sub-topics/induced-deportment-characterisation)\n\n* * *\n\n[Click here to proceed to the next Activity on Bulk Sorting](/pages/wikiore-activity-3-bulk-sorting)"},"image":null},"intro":{"text":""},"orderNumber":null},{"__typename":"Platform_Page","id":"65d2edb6ebf7bb9388ffb00f","name":"Introduction to CRC ORE","path":"/appendices/wikiore-introduction-to-crc-ore","slug":"wikiore-introduction-to-crc-ore","title":null,"subtitle":null,"pretitle":null,"openGraph":{"description":{"text":" CRC ORE was an Australian not for profit organisation funded by the global minerals industry and Australian Federal Government. It was a [cooperative research centre](https://www.industry.gov.au/funding-and-incentives/cooperative-research-centres) (CRC) responsible for furthering research to optimise resource extraction (ORE). The organisation’s key objective was to ensure that it delivers significant economic, environmental and social benefits to Australia. CRC ORE aims to transform the minerals sector by deploying innovative world-class technology to effect a step change in value across the whole-of-mine system. It assisted to ‘Optimise Resource Extraction’ through site implementation of innovative technology and applied research to improve overall productivity. \n \nIts prime directive was to identify and implement innovative solutions that can improve operational value and reverse the marked trend of declining productivity over the last decade. CRCORE achieved this through applied innovation, technology development and technology transfer focus rather than undertaking fundamental research. This was based on the view that there is abundant existing and latent technology already available which had not been integrated on mining sites or could be accessed from other sectors. \n \nCRC ORE was focused on radically improving the productivity, energy and water signatures of our mining operations. It was also dedicated to reversing the ‘conventional wisdom’ of grade decline through new [gangue](https://en.wikipedia.org/wiki/Gangue) rejection techniques. CRC ORE research projects investigated all elements of the mining process, seeking opportunities to optimise the system through better understanding of the processes and the synergies between processes. This included ore body characterisation, [geomet](https://en.wikipedia.org/wiki/Geometallurgy)allurgy, blasting, [comminution](https://en.wikipedia.org/wiki/Comminution), mine planning and economic evaluation. \n \nCRC ORE commenced in mid-2010 and after its initial 5-year funding term, was awarded a further 6-years of funding until July 2021. CRC ORE achieved support of over $160m in investment to achieve critical mass and capacity. This includes $34.4m in federal funding, with the remaining investment through Mining Companies, Mining Engineering Technology Suppliers (METS) and Research participants.\n\n_In November 2020, global multidisciplinary management, engineering and development consultancy Hatch was awarded an exclusive licence to commercialise Grade Engineering® Consulting Services._\n\n_For all enquiries regarding Grade Engineering consulting services, please contact Hugh Sherman, Process Engineer, Mining and Minerals Processing, Hatch: hugh.sherman@hatch.com_ \n\n \n**Participants:** [Mining Companies](/pages/wikiore-participants-mining-companies), [Mining Engineering Technology Suppliers (METS](/pages/wikiore-participants-mining-engineering-technology-suppliers-mets)), [Research Organisations](/pages/wikiore-participants-research-organisations), [METS Associates](/pages/wikiore-participants-mets-associates)\n\n**CRC ORE:** [Staff](/pages/wikiore-staff), [Students](/pages/wikiore-students)\n\n* * *\n\n* * *\n\n [Next: What is Grade Engineering](/pages/wikiore-introduction-to-grade-engineering)"},"image":null},"intro":{"text":""},"orderNumber":null},{"__typename":"Platform_Page","id":"65d2edb6ebf7bb9388ffb022","name":"Participants: Mining Companies","path":"/appendices/wikiore-participants-mining-companies","slug":"wikiore-participants-mining-companies","title":null,"subtitle":null,"pretitle":null,"openGraph":{"description":{"text":"### Anglo American[](#Anglo_American)\n\nAnglo American is a globally diversified mining business. Anglo American’s people are at the heart of their business. Their people use the latest technologies to find new resources, plan and build our mines and who mine, process and move and market our products – from diamonds (through De Beers) to platinum and other precious metals and copper – to customers around the world. Anglo American works together with key partners and stakeholders to unlock the long-term value that those resources represent for shareholders, and for the communities and countries in which they operate – creating sustainable value.\n\n[www.angloamerican.com](http://www.angloamerican.com)\n\n### AngloGold Ashanti[](#AngloGold_Ashanti)\n\nAngloGold Ashanti is the third-largest gold mining company in the world, by production. It has 17 gold mines in nine countries, as well as several exploration programs in both the established and new gold producing regions of the world. With a portfolio of many assets and differing ore body types in key gold producing regions, AngloGold Ashanti’s operations are supported by extensive exploration activities. AngloGold has joined CRC ORE as part of its broader strategy of positioning the company for future growth. The organisation is keenly focused on ensuring the most efficient day-to-day operation of the business, whilst also keep an eye on creating a competitive pipeline of long-term opportunities.\n\n[www.anglogoldashanti.com](http://www.anglogoldashanti.com)\n\n### BHP[](#BHP)\n\nBHP is the world’s largest mining company, BHP brings over 100 years’ experience in the industry with a portfolio of operations and projects which spans every commodity and continent. BHP is among the world’s top producers of major commodities including iron ore, metallurgical coal, copper and uranium, and also with substantial interests in oil, gas and energy coal. BHP extracts and processes minerals, oil and gas from production operations located primarily in Australia and the Americas. Products are sold worldwide, with sales and marketing led through Singapore and Houston, United States. The company aims to maximise the social and economic benefits of their operations, contribute to economic development and minimise their environmental footprint through innovation, productivity and technology.\n\n[www.bhp.com](http://www.bhp.com)\n\n### Newcrest[](#Newcrest)\n\nNewcrest is one of the world’s largest gold mining companies and operates mines in four countries. Newcrest’s focus is on long-term value creation with an emphasis on three key value drivers: maintaining low costs, growing reserves and production and using capital efficiently. Its mission is to deliver superior returns from finding, developing and operating gold/copper mines and vision is to be the Miner of choice™.\n\n[www.newcrest.com.au](http://www.newcrest.com.au)\n\n### Glencore[](#Glencore)\n\nGlencore has operated in Australia for nearly 20 years and holds significant interests in a range of commodity industries across all mainland states and the Northern Territory. Headquartered in Sydney, we are a major Australian employer, with about 16,000 people working across industries that include coal, copper, zinc, nickel, oil and agricultural products.\n\n[www.glencore.com.au](http://www.glencore.com.au)\n\n### Teck[](#Teck)\n\nTeck is Canada’s largest diversified resources company. Teck’s portfolio includes copper, steelmaking, zinc, energy and coal operations across North America, Peru and Chile. Teck is a diversified resource company committed to responsible mining and mineral development and is focused on providing products that are essential to building a better quality of life for people around the globe.\n\n[www.teck.com](http://www.teck.com)\n\n### Summit Mining International[](#Summit_Mining_International)\n\nSummit Mining International is a wholly owned subsidiary of Sumitomo Corporation known for developing and employing innovative technology, via its global network, of high-quality materials such as non-ferrous metals, electronics and advanced materials. Summit’s operations are underpinned by the principles of compliance, environmental protection, operational safety and fulfilling its social responsibilities as a manufacturing enterprise.\n\n[www.summitmininginternational.com](http://www.summitmininginternational.com)"},"image":null},"intro":{"text":""},"orderNumber":null},{"__typename":"Platform_Page","id":"65d2edb6ebf7bb9388ffb013","name":"Natural Deportment Characterisation","path":"/appendices/wikiore-natural-deportment-characterisation-act-1-link","slug":"wikiore-natural-deportment-characterisation-act-1-link","title":null,"subtitle":null,"pretitle":null,"openGraph":{"description":{"text":"Introduction[](#Introduction)\n=============================\n\n[natural deportment](/pages/wikiore-natural-deportment) laboratory testing aims to determine if specific [assay](https://en.wikipedia.org/wiki/Assay) elements (as a proxy for mineralogy) are preferentially deporting by size. Typically expressed as a systematic increase in concentration in finer size fractions. \n \n[assay](https://en.wikipedia.org/wiki/Assay)s from a series of size fractions for each sample are used to generate Response Curves. A mathematical function is then calculated across individual curves to generate a [Response Ranking](/sub-topics/natural-deportment-characterisation) (RR) - a single number used to describe the magnitude of a Response Curve. [Response Ranking](/sub-topics/natural-deportment-characterisation)s are used as inputs into [Grade Engineering](/pages/wikiore-introduction-to-grade-engineering) [block model](https://en.wikipedia.org/wiki/Mineral_resource_estimation#Resource_block_model)s, process simulations and economic evaluations. \n \nTesting can be carried out at drill core, blast hole chip or ROM scale although transforms are required to compare different scales. drill core testing is referred to as '[variability testing](/sub-topics/natural-deportment-characterisation)'. Testing of material at ROM scale is referred to as '[bulk testing](/sub-topics/sampling)', up to and including Production Trials. Depending on [opportunity assessment](/sub-topics/opportunity-assessments) requirements and site considerations a selection will be made regarding an appropriate sample type to test. \n \nTesting programs are conducted in two stages:\n\n1. An initial evaluation phase to select size fractions that generate optimal mass distributions typically involving 5-6 size fractions, and\n2. Routine testing based on a smaller number of size fractions (typically four) selected based on stage 1 mass results.\n\n[variability testing](/sub-topics/natural-deportment-characterisation)[](#variability_testing)\n==============================================================================================\n\n[variability testing](/sub-topics/natural-deportment-characterisation) can be carried out using coarse residues generated by [crushing](https://en.wikipedia.org/wiki/Crusher) during routine laboratory [assay](https://en.wikipedia.org/wiki/Assay) preparation as a precursor to pulverisation. Many projects/sites routinely store coarse residues specifically for future testing or check [assay](https://en.wikipedia.org/wiki/Assay)ing. In this case stored coarse residues can be used for cost effective testing. Stored pulps are not suitable for [variability testing](/sub-topics/natural-deportment-characterisation) as material has undergone excessive breakage and [natural deportment](/pages/wikiore-natural-deportment) signatures have been lost. \n \n[crushing](https://en.wikipedia.org/wiki/Crusher) protocols for coarse residues vary between sites and companies. These residues are produced with the aim to reduce the top size of a [particle size](https://en.wikipedia.org/wiki/Particle_size) distribution to a statistically suitable point for accurately splitting a portion to be used for fine pulverising prior to chemical [assay](https://en.wikipedia.org/wiki/Assay)ing. A typical top size for coarse residues is 99% passing -3.35mm or the equivalent #6 mesh (occasionally referred to as 80% passing 2mm). \n \n[particle size](https://en.wikipedia.org/wiki/Particle_size) distributions are a function of crusher gap settings, drill core sizes and rock hardness. Crusher gap settings in particular can vary between laboratories or drift over time. Within limits this variability does not affect use of coarse residues for [variability testing](/sub-topics/natural-deportment-characterisation). However, it is necessary to establish actual [particle size](https://en.wikipedia.org/wiki/Particle_size) distributions for site specific coarse residues as part of an initial evaluation program in order to select optimal sieve sizes for routine testing. \n \nMass of specific sieve size fractions is also monitored during routine testing before samples are sent for [assay](https://en.wikipedia.org/wiki/Assay)ing to provide a qa/qc flag for samples that show unusual mass distributions that may not be suitable for testing. sieve size selections primary objective is the generation of a minimum number of data points to define a statistically meaningful Response Curve and Ranking. This requires a minimum of three sieve sizes (generating four size fractions) across the cumulative mass range.\n\nSelection of Optimal Sieve Sizes[](#Selection_of_Optimal_Sieve_Sizes)\n=====================================================================\n\nsieve size selection aims to ensure roughly equal masses in each fraction. This provides sufficient coverage on a Response Curve diagram to generate statistical confidence in an eventual [Response Ranking](/sub-topics/natural-deportment-characterisation) and subsequent modelling activities. Ideal mass in each fraction is calculated by 100%/'n' where 'n' is the number of sizes being generated by the testing. \n \nAs an example, if 5 sizes are planned then ideal mass per fraction is ~20%. Some variation around this is normal and expected however if masses deviate substantially from this as shown in the table below then selected size fractions should be adjusted.\n\nsize fraction #\n\nIdeal Mass\n\nFailed Mass qa/qc\n\nPassed Mass qa/qc\n\n1\n\n20%\n\n40%\n\n17%\n\n2\n\n20%\n\n10%\n\n23%\n\n3\n\n20%\n\n20%\n\n18%\n\n4\n\n20%\n\n5%\n\n19%\n\n5\n\n20%\n\n25%\n\n23%\n\nThere is no 'correct' set of sieve sizes or look up function for correct sizes, as long as mass distribution objectives are met then the selection is considered appropriate for those samples. It is recommended that for an initial evaluation (first 20-50 samples) five sieves are used (giving six fractions). This can be reduced to 3 sieves depending on Response Curve variability and consistency of mass fraction data.\n\n[Response Ranking](/sub-topics/natural-deportment-characterisation) (RR)[](#Response_Ranking_RR_)\n=================================================================================================\n\nCRC OREs [Response Ranking](/sub-topics/natural-deportment-characterisation) approach allows results to be systematically and routinely processed and interpreted. This facilitates comparative ranking between deposits and domaining GE within deposits. RR is a mathematical function that can be used as an input into a range of CRC ORE modelling and simulation software environments to determine operational [Grade Engineering](/pages/wikiore-introduction-to-grade-engineering) scenarios and value utilising screening. [Response Ranking](/sub-topics/natural-deportment-characterisation)s are neither related or dependent on head grade, which acts as a modifying attribute. \n \nRR values are independent characteristics and, rather than providing an answer, allow for the calculation of a range of outcomes. They are the [Grade Engineering](/pages/wikiore-introduction-to-grade-engineering) equivalent of processing attributes (Bond work index, A\\*b,SPI etc...). Values by themselves do not indicate what mass pull gives optimum upgrade or what grade categories it should be applied to. These are dynamic operational decisions driven by RR but optimized by operational considerations and economics (more detail on this is available in ((STRATEGIC PLANNING WITH [Grade Engineering](/pages/wikiore-introduction-to-grade-engineering)|Chapter 8))). \n \nWhile this current section focuses on [natural deportment](/pages/wikiore-natural-deportment), the same principles and ranking methodology can be applied to any separation lever as part of [Grade Engineering](/pages/wikiore-introduction-to-grade-engineering) assessments. Comparing RR values for a site against a global comparative database is a key aspect of [Grade Engineering](/pages/wikiore-introduction-to-grade-engineering)® [opportunity assessment](/sub-topics/opportunity-assessments)s. Experience to date indicates when a site presents with RR >~60 at [variability testing](/sub-topics/natural-deportment-characterisation) scale a high baseline opportunity generally exists. \n \nAlthough generating, processing and interpreting this data is relatively straightforward, systematic databases of [grade by size](/pages/wikiore-natural-deportment) data from drill core testing, production scale testing (e.g. [belt cut](/sub-topics/sampling)s or [truck](https://en.wikipedia.org/wiki/Haul_truck)s) or mill surveys, remains rare in the industry. This lack of data means that opportunities are typically overlooked on most operations stressing the importance of undertaking rapid assessment programs. CRC ORE continues to generate a significant centralized database of [grade by size](/pages/wikiore-natural-deportment) data across a range of deposit styles and sample types which can increasingly be used to rank and compare individual sites against a global dataset.\n\n[response factor](/sub-topics/natural-deportment-characterisation)s (RF)[](#response_factors_RF_)\n-------------------------------------------------------------------------------------------------\n\nIn [Grade Engineering](/pages/wikiore-introduction-to-grade-engineering), relative differences between separated fractions and feed grade is referred to as a [response factor](/sub-topics/natural-deportment-characterisation) (RF). RF is a function of rock type and its interaction with separation lever technologies and can be calculated one of two ways:\n\n1. New cumulative grade of undersize material / feed grade of sample\n2. Relative cumulative metal percent / relative cumulative mass percent\n\nAs both calculation methods normalise for starting grade/metal this allows for a standard graph to be produced to compare a set of results, irrespective of feed grade variations. \n \n[response factor](/sub-topics/natural-deportment-characterisation) varies as a function of mass pull, with a small mass retained (10-30%) typically giving a high [response factor](/sub-topics/natural-deportment-characterisation) while a high mass retained (>70%) gives a lower value. This co-dependency between [response factor](/sub-topics/natural-deportment-characterisation) and mass is why CRC ORE identified a need for a standardised method to normalise responses. \n \nAn example of laboratory scale testing for [response factor](/sub-topics/natural-deportment-characterisation)s is shown below. Data points represent actual test laboratory results using crushed drill core at a range of screen sizes.\n\n \n [](https://res.cloudinary.com/shapeable/image/upload/v1687255689/wikiore/110.jpg) \n\n[response factor](/sub-topics/natural-deportment-characterisation)s have two main properties useful for characterisation. Firstly, there is a maximum theoretical limit for any given mass pull as metal is constrained within the feed sample. This produces a limit of 100%/’m’ where ‘m’ is the cumulative undersize mass. The second useful property defines a no response result. Calculations for this mean that associated metal pulls will always be equal to mass pulls (40% mass = 40% metal, 90% mass = 90% metal etc…). Tabulated results below show both a maximum theoretical |LHS| and a no response |RHS| set of values included associated RF calculations.\n\nMass (%)\n\nMetal (%)\n\nRF\n\n \n\nMass (%)\n\nMetal (%)\n\nRF\n\n100\n\n100\n\n1.00\n\n \n\n100\n\n100\n\n1.00\n\n80\n\n100\n\n1.25\n\n \n\n80\n\n80\n\n1.00\n\n60\n\n100\n\n1.67\n\n \n\n60\n\n60\n\n1.00\n\n40\n\n100\n\n2.50\n\n \n\n40\n\n40\n\n1.00\n\n20\n\n100\n\n5.00\n\n \n\n20\n\n20\n\n1.00\n\nMaximum theoretical responses at a given mass pull can be expressed as RF = m -1, while the no response is expressed as RF = m. This provides a list of potential reference curves utilising the equation RF = m RS where RS is a response score between 0 and 1 (assuming upgrading into finer fractions). These curves, once converted to log/-log space, generate straight lines with their respective slope being defined by RS.\n\n [](https://res.cloudinary.com/shapeable/image/upload/v1687255691/wikiore/106.jpg) \n\nScaling to Response Ranking[](#Scaling_to_Response_Ranking)\n-----------------------------------------------------------\n\nRR values are calculated by the following equation:\n\n [](https://res.cloudinary.com/shapeable/image/upload/v1687255692/wikiore/111.jpg) \n\nThey are generally scaled from 0-200 with 200 representing a theoretical maximum response. Negative values can be observed, indicating increasing concentration in coarse size fractions, however are not typical. Higher RR values indicate greater potential for separation from a feed material. \n \nRR values are calculated for each individual point within a given [natural deportment](/pages/wikiore-natural-deportment) sample. Resulting average values are then determined along with variations in associated Response Scores to provide a measure of fit to the expected trend. From the example below an average RR value of 68 is produced with an associated [standard deviation](https://en.wikipedia.org/wiki/Standard_deviation) in RS (StDev) of 0.03.\n\nSize\n\nMass (%)\n\nMetal (%)\n\n[response factor](/sub-topics/natural-deportment-characterisation) (RF)\n\nResponse Score (RS)\n\nResponse Rank (RR)\n\n\\>50mm\n\n80\n\n86\n\n1.08\n\n0.32\n\n65\n\n50-19mm\n\n60\n\n70\n\n1.17\n\n0.30\n\n60\n\n19-9.5mm\n\n40\n\n55\n\n1.38\n\n0.35\n\n70\n\n<9.5mm\n\n20\n\n37\n\n1.85\n\n0.38\n\n76\n\n \n[](https://res.cloudinary.com/shapeable/image/upload/v1687255694/wikiore/113.jpg)\n\nQA/QC Data Analysis[](#QA_QC_Data_Analysis)\n-------------------------------------------\n\nqa/qc is a measure of curve fit to the mathematical model function which can be expressed as [standard deviation](https://en.wikipedia.org/wiki/Standard_deviation) against the [Response Ranking](/sub-topics/natural-deportment-characterisation). Curve shape and associated response attributes can be displayed using the [grade by size](/pages/wikiore-natural-deportment) Data Viewer. A snapshot of the user interface indicates the key functionalities. Any sample or element in the analytical suite can be selected for visualization. Examples of acceptable and non-acceptable qa/qc results are illustrated below. \n \nIt should be noted that other analytical elements (as proxies for mineralogy) can exhibit different [Response Ranking](/sub-topics/natural-deportment-characterisation)s as a function of different breakage and textural associations coupled with analytical precision. Intra-sample [Response Ranking](/sub-topics/natural-deportment-characterisation) differences between elements become more pronounced when specific elements reflect increasingly diverse mineralogies. As an example Fe can be associated with a wide range of [sulphides](https://en.wikipedia.org/wiki/Sulfide_mineral), oxides, silicates and carbonates. \n \n[Response Ranking](/sub-topics/natural-deportment-characterisation) [standard deviation](https://en.wikipedia.org/wiki/Standard_deviation)s less than 0.05 (10RR units) are considered to be high quality; results between 0.05-0.10 (10-20RR units) are acceptable but are typically individually assessed; whereas values over 0.1 (20RR units) for drill core testing are regarded as failing qa/qc. [standard deviation](https://en.wikipedia.org/wiki/Standard_deviation) plus accurate sieve size selection ensures data points cover the full cumulative mass range and ensures down stream modelling activites are accurate. \n \nIn the example below the sample represented by the black line fails this qa/qc stage due to a significant deviation from the expected trend (this sample has a StDev of 0.18). [Response Ranking](/sub-topics/natural-deportment-characterisation)s that pass qa/qc are used for further analysis as well as to compare and bench mark responses for selected [assay](https://en.wikipedia.org/wiki/Assay) elements and associations.\n\n \n[](https://res.cloudinary.com/shapeable/image/upload/v1687255689/wikiore/110.jpg)\n\n### Negative RR Values[](#Negative_RR_Values)\n\nAlthough typical RR values will range from 0 to 200 there is a subset that can present with negative values. Care is needed when dealing with these as, mathematically, they can technically range to negative infinity. It should be noted that an RR of -1200 is completely valid although highly skewed. Given qa/qc steps such values have increased thresholds to pass as they naturally produce high StDev values. Depending on the specific activity leaving negative results as they are may be valid however in cases such as averaging domains or spatial population they can present with challenges. \n \nTo resolve this issue true negative RR values can be calculated which aim to scale all negative results between -200 and 0. This process involves inverting the standard RR equation to calculate a relative upgrade for mass per metal and then taking this calculated value as the true negative result (equation shown below). An example comparison between the standard RR and true negative RR is highlighted in the following table.\n\n[](https://res.cloudinary.com/shapeable/image/upload/v1687255696/wikiore/163.jpg)\n\nExample\n\nMass%\n\nMetal%\n\nRR\n\nStandard RR\n\n60%\n\n10%\n\n\\-702\n\nTrue Negative RR\n\n60%\n\n10%\n\n\\-156\n\n### Activity 1: RR Calculation[](#Activity_1:_RR_Calculation)\n\nClick [Here](/pages/wikiore-activity-1-natural-deportment) for a practical activity to calculate RR values from grade and mass data\n\nRR Analysis[](#RR_Analysis)\n---------------------------\n\nOnce results have been processed and samples put through qa/qc an initial analysis is conducted to determine any high level controls or links on RR. Note: graphs in the following section were generated using [Reflex's ioGAS software](https://reflexnow.com/product/iogas/) however analysis can be conducted in any package. \n \nGenerally the first stage of any analysis is to evaluate each site domain to determine if a uniform response is present across the entire orebody or if specific rock types/domains respond differently. \n \n[](https://res.cloudinary.com/shapeable/image/upload/v1687255698/wikiore/161.jpg) \n \nNext, relationships between each samples individual RRs should be evaluated to define any that present with offset deportment. Meaning as one element upgrades another doesn't, or does so at a different rate. For the [Neytiri](/sub-topics/a-practical-example-of-grade-engineering-evaluation) dataset as both Gold and Copper are present these can be compared. In a [Grade Engineering](/pages/wikiore-introduction-to-grade-engineering) study this should be done for all elements especially including any deleterious elements as this can impact on [Grade Engineering](/pages/wikiore-introduction-to-grade-engineering) application options. \n \n[](https://res.cloudinary.com/shapeable/image/upload/v1687255699/wikiore/157.jpg) \n \nIn the above figure the 1:1 reference line shows where both elements show identical [natural deportment](/pages/wikiore-natural-deportment) behaviors. Results plotting above this line indicate that Cu is concentrating at a higher rate than Au and vice versa for results below the line. The coloured [Response Ranking](/sub-topics/natural-deportment-characterisation) reference zones can be used to compare and bench mark responses. Based on extensive CRC ORE testing and [Grade Engineering](/pages/wikiore-introduction-to-grade-engineering) assessments across a range of deposits and deposit types, [Response Ranking](/sub-topics/natural-deportment-characterisation)s above 60 for [variability testing](/sub-topics/natural-deportment-characterisation) are considered to show potential for [natural deportment](/pages/wikiore-natural-deportment) as a dominant [Grade Engineering](/pages/wikiore-introduction-to-grade-engineering) value driver. [Response Ranking](/sub-topics/natural-deportment-characterisation)s of 20-60 are considered to indicate that integration of [natural deportment](/pages/wikiore-natural-deportment) with an additional lever such as [differential blasting](/pages/wikiore-induced-deportment) will be required to deliver value. [Response Ranking](/sub-topics/natural-deportment-characterisation)s below 20 are considered to indicate that [natural deportment](/pages/wikiore-natural-deportment) will not be a significant driver. Negative RR values indicate an inversed relationship than expected between size and grade and need to be treated separately. \n \nAny relationships found at this stage of analysis that can discriminate samples falling into these bins should be noted as it will aid in spatial population and downstream predictions. \n \nThis analysis method is useful for tracking mineralogical signatures of [natural deportment](/pages/wikiore-natural-deportment). For example, if significant amounts of pyrite were preferentially deporting by size compared to initial mineralogy of the head sample, it would be expected that the [Response Ranking](/sub-topics/natural-deportment-characterisation) S:Cu ratio would increase. Conversely if high Cu-sulphide phases such as bornite or chalcocite were preferentially deporting then the [Response Ranking](/sub-topics/natural-deportment-characterisation) S:Cu ratio would decrease. \n \nIn the extensive data sets developed in CRC ORE projects to-date, no relationship between head grade and RR has been observed. This reflects the dominant control between association and paragenesis rather than abundance. Although no strong link between head grade and RR has been observed if such a link is ever found at a particular site it will have a profound impact on down streamGE processes. \n \n[Work](/pages/wikiore-p-1-006-geological-controls-on-grade-by-size) is ongoing to determine fundamental geological controls on variable [natural deportment](/pages/wikiore-natural-deportment) responses to develop predictive models. \n \nDiversity of geological control is reflected in significant variability of [Response Ranking](/sub-topics/natural-deportment-characterisation) evident for typical testing programs. It is recommended that for initial assessment of [grade by size](/pages/wikiore-natural-deportment) typically developed using drill core residues; composite sample intervals similar to [metallurgical](https://en.wikipedia.org/wiki/Metallurgy) composites or nominal bench height are used. As an initial assessment a sample selection matrix of different ore types/lithologies, alteration styles and grade classes should be developed until more coherent RR groupings are recognized as discrete domains. This typically involves a minimum of 100 samples to adequately cover a sample selection matrix. As for any [geomet](https://en.wikipedia.org/wiki/Geometallurgy)allurgical style attribute or domaining exercise an extensive sampling and testing program eventually involving thousands of samples, may be required to support domaining in situations of high variability. As the database grows assignment of average RR by geological category is generally undertaken. \n \nFor extensive multi-element data RR’s for individual elements can be comparatively ranked to highlight associations which typically provide information on probable controls. In the case of the mesothermal gold example a very strong correlation between high RR for Au, Bi, Ag and S is evident. In the case of the porphyry Cu example Mo shows high RR while Cu, Zn, Ag, S, Pb and Cu show a closeting of moderate RR. This may indicate that the moderate Cu RR response is related to late stage base metal-bearing veins rather than earlier paragenetic Cu associations in veins or disseminations which are not reporting as preferential [grade by size](/pages/wikiore-natural-deportment) related breakage. \n \nThe [Response Ranking](/sub-topics/natural-deportment-characterisation) approach developed by CRC ORE allows [grade by size](/pages/wikiore-natural-deportment) data to be systematically and routinely processed and interpreted for qa/qc. This facilitates comparative ranking between deposits and definition of variability and domaining within deposits. Comparative ranking is particularly suited for testing of coarse [assay](https://en.wikipedia.org/wiki/Assay) residues where the residues have been generated using a constrained sample preparation and size reduction approach. \n \nAlthough generating [grade by size](/pages/wikiore-natural-deportment) data and more recently processing and interpreting this data is relatively straightforward, systematic databases of [grade by size](/pages/wikiore-natural-deportment) data from drill core testing, production scale testing (e.g. [belt cut](/sub-topics/sampling)s or trucks) or mill surveys, remains rare in the industry. This lack of data means that [grade by size](/pages/wikiore-natural-deportment) opportunity is typically overlooked on most operations stressing the importance of undertaking rapid assessment programs. CRC ORE continues to generate a significant centralized database of [grade by size](/pages/wikiore-natural-deportment) data across a range of deposit styles and sample types which can increasingly be used to rank and compare individual sites against a global dataset. [Response Ranking](/sub-topics/natural-deportment-characterisation)s above 60 for drill core scale testing indicate potential for [grade by size](/pages/wikiore-natural-deportment) to be considered as a dominant [Grade Engineering](/pages/wikiore-introduction-to-grade-engineering) value driver. \n \n[Response Ranking](/sub-topics/natural-deportment-characterisation)s are mathematical functions that can be used as inputs into a range of CRC ORE modelling and simulation software to determine operational [Grade Engineering](/pages/wikiore-introduction-to-grade-engineering) scenarios and value. [Response Ranking](/sub-topics/natural-deportment-characterisation)s are not related to or dependent on head grade, which acts as a modifying attribute. The higher the RR the higher the potential to use [grade by size](/pages/wikiore-natural-deportment) and resulting screening to separate new accept and reject type #feed streams. RR by itself does not indicate what mass pull gives optimum upgrade or what grade categories it should be applied to. These are dynamic operational decisions driven by RR but optimized by operational considerations and economics.\n\n \nDownload the RR data used in this analysis [ ](https://res.cloudinary.com/shapeable/raw/upload/v1687303408/wikiore/357.php)[Neytiri RR data](https://res.cloudinary.com/shapeable/raw/upload/v1687303408/wikiore/357.php)\n\nWorkflow for Natural Deportment Characterisation[](#Workflow_for_Natural_Deportment_Characterisation)\n-----------------------------------------------------------------------------------------------------\n\n [](https://res.cloudinary.com/shapeable/image/upload/v1687303115/wikiore/108.jpg) \n\nDomaining Variability Responses[](#Domaining_Variability_Responses)\n===================================================================\n\nOnce analysis has been completed this information passed on for population into the [Grade Engineering](/pages/wikiore-introduction-to-grade-engineering) [block model](https://en.wikipedia.org/wiki/Mineral_resource_estimation#Resource_block_model). More detail on specific methodologies used for this can be found [here](/sub-topics/spatial-population).\n\nProduction [Scale-Up](Scale-Up)[](#Production_Scale-Up)\n-------------------------------------------------------\n\nPrevious CRC ORE studies have observed a relatively consistent increase in [Response Ranking](/sub-topics/natural-deportment-characterisation)s when moving from drill core [variability testing](/sub-topics/natural-deportment-characterisation) scale to production scale. This difference is usually accounted for in what is referred to as a “[scale-up](/sub-topics/natural-deportment-characterisation) Factor”. This is applied across all drill core test results to bring them into line with expected production scale responses. Studies to date have found two common [scale-up](/sub-topics/natural-deportment-characterisation) Factors; the first at approximately x1.20 and a second at x1.60. This has been observed to vary both across and within a given site. \n \nCRC ORE has observed only a single case where production scale responses were lower than those measured at drill core scale ([scale-up](/sub-topics/natural-deportment-characterisation) Factor = x0.50).\n\n \nExample of normal [scale-up](/sub-topics/natural-deportment-characterisation) relationship between drill core (red) and bulk samples (blue).\n\n [](https://res.cloudinary.com/shapeable/image/upload/v1687303116/wikiore/109.jpg) \n\n[Bulk testing](/sub-topics/sampling)[](#Bulk_testing)\n=====================================================\n\n[bulk testing](/sub-topics/sampling) is critical in determining both production scale responses and associated [scale-up](/sub-topics/natural-deportment-characterisation) factors for drill core results. Ideally ROM or post [primary crusher](https://en.wikipedia.org/wiki/Crusher) material should be sampled and evaluated using the exact same protocols as [variability testing](/sub-topics/natural-deportment-characterisation) to determine; ideal sizes, grades, [response factor](/sub-topics/natural-deportment-characterisation)s and [Response Ranking](/sub-topics/natural-deportment-characterisation)s. \n \nMore detail on how to effectively sample bulk material is found [here.](/sub-topics/sampling)\n\nProduction Trials[](#Production_Trials)\n=======================================\n\nDetails on conducting Production Trials can be found here: [Site Trials](/sub-topics/site-trials)\n\n \n \n\n* * *\n\n* * *\n\n[Previous Section: Methods](/sub-topics/methods) | (([Induced deportment](/pages/wikiore-induced-deportment) Characterisation|Next Section: [Induced deportment](/pages/wikiore-induced-deportment) Characterisation))"},"image":null},"intro":{"text":""},"orderNumber":null},{"__typename":"Platform_Page","id":"65d2edb6ebf7bb9388ffb004","name":"Fluorescence Sensors","path":"/appendices/wikiore-fluorescence-sensors","slug":"wikiore-fluorescence-sensors","title":null,"subtitle":null,"pretitle":null,"openGraph":{"description":{"text":"Table of contents:\n\n* [P1-005 Upconversion Fluoresence](/pages/wikiore-p-1-005-upconversion-fluoresence)"},"image":null},"intro":{"text":""},"orderNumber":null},{"__typename":"Platform_Page","id":"65d2edb6ebf7bb9388ffb014","name":"Natural Deportment Characterisation","path":"/appendices/wikiore-22-natural-deportment-characterisation","slug":"wikiore-22-natural-deportment-characterisation","title":null,"subtitle":null,"pretitle":null,"openGraph":{"description":{"text":"Introduction[](#Introduction)\n=============================\n\n[](tiki-editpage.php?page=%3Ca+href%3D%22tiki-index.php%3Fpage%3DNatural-Deportment%22+title%3D%22Natural+Deportment%22+class%3D%22wiki+wiki_page%22%3Enatural+deportment%3C%2Fa%3E)[natural deportment](/pages/wikiore-natural-deportment) laboratory testing aims to determine if specific [assay](https://en.wikipedia.org/wiki/Assay) elements (as a proxy for mineralogy) are preferentially deporting by size. Typically expressed as a systematic increase in concentration in finer size fractions. \n \n[assay](https://en.wikipedia.org/wiki/Assay)s from a series of size fractions for each sample are used to generate Response Curves. A mathematical function is then calculated across individual curves to generate a [Response Ranking](/sub-topics/natural-deportment-characterisation) (RR) - a single number used to describe the magnitude of a Response Curve. [Response Ranking](/sub-topics/natural-deportment-characterisation)s are used as inputs into [Grade Engineering](/pages/wikiore-introduction-to-grade-engineering) [block model](https://en.wikipedia.org/wiki/Mineral_resource_estimation#Resource_block_model)s, process simulations and economic evaluations. \n \nTesting can be carried out at drill core, blast hole chip or ROM scale although transforms are required to compare different scales. drill core testing is referred to as '[variability testing](/sub-topics/natural-deportment-characterisation)'. Testing of material at ROM scale is referred to as '[bulk testing](/sub-topics/sampling)', up to and including Production Trials. Depending on [opportunity assessment](/sub-topics/opportunity-assessments) requirements and site considerations a selection will be made regarding an appropriate sample type to test. \n \nTesting programs are conducted in two stages:\n\n1. An initial evaluation phase to select size fractions that generate optimal mass distributions typically involving 5-6 size fractions, and\n2. Routine testing based on a smaller number of size fractions (typically four) selected based on stage 1 mass results.\n\n[variability testing](/sub-topics/natural-deportment-characterisation)[](#variability_testing)\n==============================================================================================\n\n[variability testing](/sub-topics/natural-deportment-characterisation) can be carried out using coarse residues generated by [crushing](https://en.wikipedia.org/wiki/Crusher) during routine laboratory [assay](https://en.wikipedia.org/wiki/Assay) preparation as a precursor to pulverisation. Many projects/sites routinely store coarse residues specifically for future testing or check [assay](https://en.wikipedia.org/wiki/Assay)ing. In this case stored coarse residues can be used for cost effective testing. Stored pulps are not suitable for [variability testing](/sub-topics/natural-deportment-characterisation) as material has undergone excessive breakage and [natural deportment](/pages/wikiore-natural-deportment) signatures have been lost. \n \n[crushing](https://en.wikipedia.org/wiki/Crusher) protocols for coarse residues vary between sites and companies. These residues are produced with the aim to reduce the top size of a [particle size](https://en.wikipedia.org/wiki/Particle_size) distribution to a statistically suitable point for accurately splitting a portion to be used for fine pulverising prior to chemical [assay](https://en.wikipedia.org/wiki/Assay)ing. A typical top size for coarse residues is 99% passing -3.35mm or the equivalent #6 mesh (occasionally referred to as 80% passing 2mm). \n \n[particle size](https://en.wikipedia.org/wiki/Particle_size) distributions are a function of crusher gap settings, drill core sizes and rock hardness. Crusher gap settings in particular can vary between laboratories or drift over time. Within limits this variability does not affect use of coarse residues for [variability testing](/sub-topics/natural-deportment-characterisation). However, it is necessary to establish actual [particle size](https://en.wikipedia.org/wiki/Particle_size) distributions for site specific coarse residues as part of an initial evaluation program in order to select optimal sieve sizes for routine testing. \n \nMass of specific sieve size fractions is also monitored during routine testing before samples are sent for [assay](https://en.wikipedia.org/wiki/Assay)ing to provide a qa/qc flag for samples that show unusual mass distributions that may not be suitable for testing. sieve size selections primary objective is the generation of a minimum number of data points to define a statistically meaningful Response Curve and Ranking. This requires a minimum of three sieve sizes (generating four size fractions) across the cumulative mass range.\n\nSelection of Optimal Sieve Sizes[](#Selection_of_Optimal_Sieve_Sizes)\n=====================================================================\n\nsieve size selection aims to ensure roughly equal masses in each fraction. This provides sufficient coverage on a Response Curve diagram to generate statistical confidence in an eventual [Response Ranking](/sub-topics/natural-deportment-characterisation) and subsequent modelling activities. Ideal mass in each fraction is calculated by 100%/'n' where 'n' is the number of sizes being generated by the testing. \n \nAs an example, if 5 sizes are planned then ideal mass per fraction is ~20%. Some variation around this is normal and expected however if masses deviate substantially from this as shown in the table below then selected size fractions should be adjusted.\n\nsize fraction #\n\nIdeal Mass\n\nFailed Mass qa/qc\n\nPassed Mass qa/qc\n\n1\n\n20%\n\n40%\n\n17%\n\n2\n\n20%\n\n10%\n\n23%\n\n3\n\n20%\n\n20%\n\n18%\n\n4\n\n20%\n\n5%\n\n19%\n\n5\n\n20%\n\n25%\n\n23%\n\nThere is no 'correct' set of sieve sizes or look up function for correct sizes, as long as mass distribution objectives are met then the selection is considered appropriate for those samples. It is recommended that for an initial evaluation (first 20-50 samples) five sieves are used (giving six fractions). This can be reduced to 3 sieves depending on Response Curve variability and consistency of mass fraction data.\n\n[Response Ranking](/sub-topics/natural-deportment-characterisation) (RR)[](#Response_Ranking_RR_)\n=================================================================================================\n\nCRC OREs [Response Ranking](/sub-topics/natural-deportment-characterisation) approach allows results to be systematically and routinely processed and interpreted. This facilitates comparative ranking between deposits and domaining GE within deposits. RR is a mathematical function that can be used as an input into a range of CRC ORE modelling and simulation software environments to determine operational [Grade Engineering](/pages/wikiore-introduction-to-grade-engineering) scenarios and value utilising screening. [Response Ranking](/sub-topics/natural-deportment-characterisation)s are neither related or dependent on head grade, which acts as a modifying attribute. \n \nRR values are independent characteristics and, rather than providing an answer, allow for the calculation of a range of outcomes. They are the [Grade Engineering](/pages/wikiore-introduction-to-grade-engineering) equivalent of processing attributes (Bond work index, A\\*b,SPI etc...). Values by themselves do not indicate what mass pull gives optimum upgrade or what grade categories it should be applied to. These are dynamic operational decisions driven by RR but optimized by operational considerations and economics (more detail on this is available in ((STRATEGIC PLANNING WITH [Grade Engineering](/pages/wikiore-introduction-to-grade-engineering)|Chapter 8))). \n \nWhile this current section focuses on [natural deportment](/pages/wikiore-natural-deportment), the same principles and ranking methodology can be applied to any separation lever as part of [Grade Engineering](/pages/wikiore-introduction-to-grade-engineering) assessments. Comparing RR values for a site against a global comparative database is a key aspect of [Grade Engineering](/pages/wikiore-introduction-to-grade-engineering)® [opportunity assessment](/sub-topics/opportunity-assessments)s. Experience to date indicates when a site presents with RR >~60 at [variability testing](/sub-topics/natural-deportment-characterisation) scale a high baseline opportunity generally exists. \n \nAlthough generating, processing and interpreting this data is relatively straightforward, systematic databases of [grade by size](/pages/wikiore-natural-deportment) data from drill core testing, production scale testing (e.g. [belt cut](/sub-topics/sampling)s or [truck](https://en.wikipedia.org/wiki/Haul_truck)s) or mill surveys, remains rare in the industry. This lack of data means that opportunities are typically overlooked on most operations stressing the importance of undertaking rapid assessment programs. CRC ORE continues to generate a significant centralized database of [grade by size](/pages/wikiore-natural-deportment) data across a range of deposit styles and sample types which can increasingly be used to rank and compare individual sites against a global dataset.\n\n[response factor](/sub-topics/natural-deportment-characterisation)s (RF)[](#response_factors_RF_)\n-------------------------------------------------------------------------------------------------\n\nIn [Grade Engineering](/pages/wikiore-introduction-to-grade-engineering), relative differences between separated fractions and feed grade is referred to as a [response factor](/sub-topics/natural-deportment-characterisation) (RF). RF is a function of rock type and its interaction with separation lever technologies and can be calculated one of two ways:\n\n1. New cumulative grade of undersize material / feed grade of sample\n2. Relative cumulative metal percent / relative cumulative mass percent\n\nAs both calculation methods normalise for starting grade/metal this allows for a standard graph to be produced to compare a set of results, irrespective of feed grade variations. \n \n[response factor](/sub-topics/natural-deportment-characterisation) varies as a function of mass pull, with a small mass retained (10-30%) typically giving a high [response factor](/sub-topics/natural-deportment-characterisation) while a high mass retained (>70%) gives a lower value. This co-dependency between [response factor](/sub-topics/natural-deportment-characterisation) and mass is why CRC ORE identified a need for a standardised method to normalise responses. \n \nAn example of laboratory scale testing for [response factor](/sub-topics/natural-deportment-characterisation)s is shown below. Data points represent actual test laboratory results using crushed drill core at a range of screen sizes.\n\n \n [](https://res.cloudinary.com/shapeable/image/upload/v1687255689/wikiore/110.jpg) \n\n[response factor](/sub-topics/natural-deportment-characterisation)s have two main properties useful for characterisation. Firstly, there is a maximum theoretical limit for any given mass pull as metal is constrained within the feed sample. This produces a limit of 100%/’m’ where ‘m’ is the cumulative undersize mass. The second useful property defines a no response result. Calculations for this mean that associated metal pulls will always be equal to mass pulls (40% mass = 40% metal, 90% mass = 90% metal etc…). Tabulated results below show both a maximum theoretical |LHS| and a no response |RHS| set of values included associated RF calculations.\n\nMass (%)\n\nMetal (%)\n\nRF\n\n \n\nMass (%)\n\nMetal (%)\n\nRF\n\n100\n\n100\n\n1.00\n\n \n\n100\n\n100\n\n1.00\n\n80\n\n100\n\n1.25\n\n \n\n80\n\n80\n\n1.00\n\n60\n\n100\n\n1.67\n\n \n\n60\n\n60\n\n1.00\n\n40\n\n100\n\n2.50\n\n \n\n40\n\n40\n\n1.00\n\n20\n\n100\n\n5.00\n\n \n\n20\n\n20\n\n1.00\n\nMaximum theoretical responses at a given mass pull can be expressed as RF = m -1, while the no response is expressed as RF = m. This provides a list of potential reference curves utilising the equation RF = m RS where RS is a response score between 0 and 1 (assuming upgrading into finer fractions). These curves, once converted to log/-log space, generate straight lines with their respective slope being defined by RS.\n\n [](https://res.cloudinary.com/shapeable/image/upload/v1687255691/wikiore/106.jpg) \n\nScaling to Response Ranking[](#Scaling_to_Response_Ranking)\n-----------------------------------------------------------\n\nRR values are calculated by the following equation:\n\n [](https://res.cloudinary.com/shapeable/image/upload/v1687255692/wikiore/111.jpg) \n\nThey are generally scaled from 0-200 with 200 representing a theoretical maximum response. Negative values can be observed, indicating increasing concentration in coarse size fractions, however are not typical. Higher RR values indicate greater potential for separation from a feed material. \n \nRR values are calculated for each individual point within a given [natural deportment](/pages/wikiore-natural-deportment) sample. Resulting average values are then determined along with variations in associated Response Scores to provide a measure of fit to the expected trend. From the example below an average RR value of 68 is produced with an associated [standard deviation](https://en.wikipedia.org/wiki/Standard_deviation) in RS (StDev) of 0.03.\n\nSize\n\nMass (%)\n\nMetal (%)\n\n[response factor](/sub-topics/natural-deportment-characterisation) (RF)\n\nResponse Score (RS)\n\nResponse Rank (RR)\n\n\\>50mm\n\n80\n\n86\n\n1.08\n\n0.32\n\n65\n\n50-19mm\n\n60\n\n70\n\n1.17\n\n0.30\n\n60\n\n19-9.5mm\n\n40\n\n55\n\n1.38\n\n0.35\n\n70\n\n<9.5mm\n\n20\n\n37\n\n1.85\n\n0.38\n\n76\n\n \n[](https://res.cloudinary.com/shapeable/image/upload/v1687255694/wikiore/113.jpg)\n\nQA/QC Data Analysis[](#QA_QC_Data_Analysis)\n-------------------------------------------\n\nqa/qc is a measure of curve fit to the mathematical model function which can be expressed as [standard deviation](https://en.wikipedia.org/wiki/Standard_deviation) against the [Response Ranking](/sub-topics/natural-deportment-characterisation). Curve shape and associated response attributes can be displayed using the [grade by size](/pages/wikiore-natural-deportment) Data Viewer. A snapshot of the user interface indicates the key functionalities. Any sample or element in the analytical suite can be selected for visualization. Examples of acceptable and non-acceptable qa/qc results are illustrated below. \n \nIt should be noted that other analytical elements (as proxies for mineralogy) can exhibit different [Response Ranking](/sub-topics/natural-deportment-characterisation)s as a function of different breakage and textural associations coupled with analytical precision. Intra-sample [Response Ranking](/sub-topics/natural-deportment-characterisation) differences between elements become more pronounced when specific elements reflect increasingly diverse mineralogies. As an example Fe can be associated with a wide range of [sulphides](https://en.wikipedia.org/wiki/Sulfide_mineral), oxides, silicates and carbonates. \n \n[Response Ranking](/sub-topics/natural-deportment-characterisation) [standard deviation](https://en.wikipedia.org/wiki/Standard_deviation)s less than 0.05 (10RR units) are considered to be high quality; results between 0.05-0.10 (10-20RR units) are acceptable but are typically individually assessed; whereas values over 0.1 (20RR units) for drill core testing are regarded as failing qa/qc. [standard deviation](https://en.wikipedia.org/wiki/Standard_deviation) plus accurate sieve size selection ensures data points cover the full cumulative mass range and ensures down stream modelling activites are accurate. \n \nIn the example below the sample represented by the black line fails this qa/qc stage due to a significant deviation from the expected trend (this sample has a StDev of 0.18). [Response Ranking](/sub-topics/natural-deportment-characterisation)s that pass qa/qc are used for further analysis as well as to compare and bench mark responses for selected [assay](https://en.wikipedia.org/wiki/Assay) elements and associations.\n\n \n[](https://res.cloudinary.com/shapeable/image/upload/v1687255689/wikiore/110.jpg)\n\n### Negative RR Values[](#Negative_RR_Values)\n\nAlthough typical RR values will range from 0 to 200 there is a subset that can present with negative values. Care is needed when dealing with these as, mathematically, they can technically range to negative infinity. It should be noted that an RR of -1200 is completely valid although highly skewed. Given qa/qc steps such values have increased thresholds to pass as they naturally produce high StDev values. Depending on the specific activity leaving negative results as they are may be valid however in cases such as averaging domains or spatial population they can present with challenges. \n \nTo resolve this issue true negative RR values can be calculated which aim to scale all negative results between -200 and 0. This process involves inverting the standard RR equation to calculate a relative upgrade for mass per metal and then taking this calculated value as the true negative result (equation shown below). An example comparison between the standard RR and true negative RR is highlighted in the following table.\n\n[](https://res.cloudinary.com/shapeable/image/upload/v1687255696/wikiore/163.jpg)\n\nExample\n\nMass%\n\nMetal%\n\nRR\n\nStandard RR\n\n60%\n\n10%\n\n\\-702\n\nTrue Negative RR\n\n60%\n\n10%\n\n\\-156\n\n### Activity 1: RR Calculation[](#Activity_1:_RR_Calculation)\n\nClick [Here](/pages/wikiore-activity-1-natural-deportment) for a practical activity to calculate RR values from grade and mass data\n\nRR Analysis[](#RR_Analysis)\n---------------------------\n\nOnce results have been processed and samples put through qa/qc an initial analysis is conducted to determine any high level controls or links on RR. Note: graphs in the following section were generated using [Reflex's ioGAS software](https://reflexnow.com/product/iogas/) however analysis can be conducted in any package. \n \nGenerally the first stage of any analysis is to evaluate each site domain to determine if a uniform response is present across the entire orebody or if specific rock types/domains respond differently. \n \n[](https://res.cloudinary.com/shapeable/image/upload/v1687255698/wikiore/161.jpg) \n \nNext, relationships between each samples individual RRs should be evaluated to define any that present with offset deportment. Meaning as one element upgrades another doesn't, or does so at a different rate. For the [Neytiri](/sub-topics/a-practical-example-of-grade-engineering-evaluation) dataset as both Gold and Copper are present these can be compared. In a [Grade Engineering](/pages/wikiore-introduction-to-grade-engineering) study this should be done for all elements especially including any deleterious elements as this can impact on [Grade Engineering](/pages/wikiore-introduction-to-grade-engineering) application options. \n \n[](https://res.cloudinary.com/shapeable/image/upload/v1687255699/wikiore/157.jpg) \n \nIn the above figure the 1:1 reference line shows where both elements show identical [natural deportment](/pages/wikiore-natural-deportment) behaviors. Results plotting above this line indicate that Cu is concentrating at a higher rate than Au and vice versa for results below the line. The coloured [Response Ranking](/sub-topics/natural-deportment-characterisation) reference zones can be used to compare and bench mark responses. Based on extensive CRC ORE testing and [Grade Engineering](/pages/wikiore-introduction-to-grade-engineering) assessments across a range of deposits and deposit types, [Response Ranking](/sub-topics/natural-deportment-characterisation)s above 60 for [variability testing](/sub-topics/natural-deportment-characterisation) are considered to show potential for [natural deportment](/pages/wikiore-natural-deportment) as a dominant [Grade Engineering](/pages/wikiore-introduction-to-grade-engineering) value driver. [Response Ranking](/sub-topics/natural-deportment-characterisation)s of 20-60 are considered to indicate that integration of [natural deportment](/pages/wikiore-natural-deportment) with an additional lever such as [differential blasting](/pages/wikiore-induced-deportment) will be required to deliver value. [Response Ranking](/sub-topics/natural-deportment-characterisation)s below 20 are considered to indicate that [natural deportment](/pages/wikiore-natural-deportment) will not be a significant driver. Negative RR values indicate an inversed relationship than expected between size and grade and need to be treated separately. \n \nAny relationships found at this stage of analysis that can discriminate samples falling into these bins should be noted as it will aid in spatial population and downstream predictions. \n \nThis analysis method is useful for tracking mineralogical signatures of [natural deportment](/pages/wikiore-natural-deportment). For example, if significant amounts of pyrite were preferentially deporting by size compared to initial mineralogy of the head sample, it would be expected that the [Response Ranking](/sub-topics/natural-deportment-characterisation) S:Cu ratio would increase. Conversely if high Cu-sulphide phases such as bornite or chalcocite were preferentially deporting then the [Response Ranking](/sub-topics/natural-deportment-characterisation) S:Cu ratio would decrease. \n \nIn the extensive data sets developed in CRC ORE projects to-date, no relationship between head grade and RR has been observed. This reflects the dominant control between association and paragenesis rather than abundance. Although no strong link between head grade and RR has been observed if such a link is ever found at a particular site it will have a profound impact on down streamGE processes. \n \n[Work](/pages/wikiore-p-1-006-geological-controls-on-grade-by-size) is ongoing to determine fundamental geological controls on variable [natural deportment](/pages/wikiore-natural-deportment) responses to develop predictive models. \n \nDiversity of geological control is reflected in significant variability of [Response Ranking](/sub-topics/natural-deportment-characterisation) evident for typical testing programs. It is recommended that for initial assessment of [grade by size](/pages/wikiore-natural-deportment) typically developed using drill core residues; composite sample intervals similar to [metallurgical](https://en.wikipedia.org/wiki/Metallurgy) composites or nominal bench height are used. As an initial assessment a sample selection matrix of different ore types/lithologies, alteration styles and grade classes should be developed until more coherent RR groupings are recognized as discrete domains. This typically involves a minimum of 100 samples to adequately cover a sample selection matrix. As for any [geomet](https://en.wikipedia.org/wiki/Geometallurgy)allurgical style attribute or domaining exercise an extensive sampling and testing program eventually involving thousands of samples, may be required to support domaining in situations of high variability. As the database grows assignment of average RR by geological category is generally undertaken. \n \nFor extensive multi-element data RR’s for individual elements can be comparatively ranked to highlight associations which typically provide information on probable controls. In the case of the mesothermal gold example a very strong correlation between high RR for Au, Bi, Ag and S is evident. In the case of the porphyry Cu example Mo shows high RR while Cu, Zn, Ag, S, Pb and Cu show a closeting of moderate RR. This may indicate that the moderate Cu RR response is related to late stage base metal-bearing veins rather than earlier paragenetic Cu associations in veins or disseminations which are not reporting as preferential [grade by size](/pages/wikiore-natural-deportment) related breakage. \n \nThe [Response Ranking](/sub-topics/natural-deportment-characterisation) approach developed by CRC ORE allows [grade by size](/pages/wikiore-natural-deportment) data to be systematically and routinely processed and interpreted for qa/qc. This facilitates comparative ranking between deposits and definition of variability and domaining within deposits. Comparative ranking is particularly suited for testing of coarse [assay](https://en.wikipedia.org/wiki/Assay) residues where the residues have been generated using a constrained sample preparation and size reduction approach. \n \nAlthough generating [grade by size](/pages/wikiore-natural-deportment) data and more recently processing and interpreting this data is relatively straightforward, systematic databases of [grade by size](/pages/wikiore-natural-deportment) data from drill core testing, production scale testing (e.g. [belt cut](/sub-topics/sampling)s or trucks) or mill surveys, remains rare in the industry. This lack of data means that [grade by size](/pages/wikiore-natural-deportment) opportunity is typically overlooked on most operations stressing the importance of undertaking rapid assessment programs. CRC ORE continues to generate a significant centralized database of [grade by size](/pages/wikiore-natural-deportment) data across a range of deposit styles and sample types which can increasingly be used to rank and compare individual sites against a global dataset. [Response Ranking](/sub-topics/natural-deportment-characterisation)s above 60 for drill core scale testing indicate potential for [grade by size](/pages/wikiore-natural-deportment) to be considered as a dominant [Grade Engineering](/pages/wikiore-introduction-to-grade-engineering) value driver. \n \n[Response Ranking](/sub-topics/natural-deportment-characterisation)s are mathematical functions that can be used as inputs into a range of CRC ORE modelling and simulation software to determine operational [Grade Engineering](/pages/wikiore-introduction-to-grade-engineering) scenarios and value. [Response Ranking](/sub-topics/natural-deportment-characterisation)s are not related to or dependent on head grade, which acts as a modifying attribute. The higher the RR the higher the potential to use [grade by size](/pages/wikiore-natural-deportment) and resulting screening to separate new accept and reject type #feed streams. RR by itself does not indicate what mass pull gives optimum upgrade or what grade categories it should be applied to. These are dynamic operational decisions driven by RR but optimized by operational considerations and economics.\n\n \nDownload the RR data used in this analysis [ ](https://res.cloudinary.com/shapeable/raw/upload/v1687303408/wikiore/357.php)[Neytiri RR data](https://res.cloudinary.com/shapeable/raw/upload/v1687303408/wikiore/357.php)\n\nWorkflow for Natural Deportment Characterisation[](#Workflow_for_Natural_Deportment_Characterisation)\n-----------------------------------------------------------------------------------------------------\n\n [](https://res.cloudinary.com/shapeable/image/upload/v1687303115/wikiore/108.jpg) \n\nDomaining Variability Responses[](#Domaining_Variability_Responses)\n===================================================================\n\nOnce analysis has been completed this information passed on for population into the [Grade Engineering](/pages/wikiore-introduction-to-grade-engineering) [block model](https://en.wikipedia.org/wiki/Mineral_resource_estimation#Resource_block_model). More detail on specific methodologies used for this can be found [here](/sub-topics/spatial-population).\n\nProduction [Scale-Up](Scale-Up)[](#Production_Scale-Up)\n-------------------------------------------------------\n\nPrevious CRC ORE studies have observed a relatively consistent increase in [Response Ranking](/sub-topics/natural-deportment-characterisation)s when moving from drill core [variability testing](/sub-topics/natural-deportment-characterisation) scale to production scale. This difference is usually accounted for in what is referred to as a “[scale-up](/sub-topics/natural-deportment-characterisation) Factor”. This is applied across all drill core test results to bring them into line with expected production scale responses. Studies to date have found two common [scale-up](/sub-topics/natural-deportment-characterisation) Factors; the first at approximately x1.20 and a second at x1.60. This has been observed to vary both across and within a given site. \n \nCRC ORE has observed only a single case where production scale responses were lower than those measured at drill core scale ([scale-up](/sub-topics/natural-deportment-characterisation) Factor = x0.50).\n\n \nExample of normal [scale-up](/sub-topics/natural-deportment-characterisation) relationship between drill core (red) and bulk samples (blue).\n\n [](https://res.cloudinary.com/shapeable/image/upload/v1687303116/wikiore/109.jpg) \n\n[Bulk testing](/sub-topics/sampling)[](#Bulk_testing)\n=====================================================\n\n[bulk testing](/sub-topics/sampling) is critical in determining both production scale responses and associated [scale-up](/sub-topics/natural-deportment-characterisation) factors for drill core results. Ideally ROM or post [primary crusher](https://en.wikipedia.org/wiki/Crusher) material should be sampled and evaluated using the exact same protocols as [variability testing](/sub-topics/natural-deportment-characterisation) to determine; ideal sizes, grades, [response factor](/sub-topics/natural-deportment-characterisation)s and [Response Ranking](/sub-topics/natural-deportment-characterisation)s. \n \nMore detail on how to effectively sample bulk material is found [here.](/sub-topics/sampling)\n\nProduction Trials[](#Production_Trials)\n=======================================\n\nDetails on conducting Production Trials can be found here: [Site Trials](https://wikiore.com.au/Site Trials)\n\n \n \n\n* * *\n\n* * *\n\n[Previous Section: Methods](/sub-topics/methods) | (([Induced deportment](/pages/wikiore-induced-deportment) Characterisation|Next Section: [Induced deportment](/pages/wikiore-induced-deportment) Characterisation))"},"image":null},"intro":{"text":""},"orderNumber":null},{"__typename":"Platform_Page","id":"65d2edb6ebf7bb9388ffb024","name":"Participants: Mining Engineering Technology Suppliers (METS)","path":"/appendices/wikiore-participants-mining-engineering-technology-suppliers-mets","slug":"wikiore-participants-mining-engineering-technology-suppliers-mets","title":null,"subtitle":null,"pretitle":null,"openGraph":{"description":{"text":"### Hatch[](#Hatch)\n\nWhatever our clients envision, our engineers can design and build. With over six decades of business and technical experience in the mining, energy, and infrastructure sectors, we know your business and understand that your challenges are changing rapidly. We respond quickly with solutions that are smarter, more efficient, and innovative. We draw upon our 9,000 staff with experience in over 150 countries to challenge the status quo and create positive change for our clients, our employees, and the communities we serve.\n\n[www.hatch.com](http://www.hatch.com)\n\n### IMDEX[](#IMDEX)\n\nREFLEX is the leader in real-time subsurface intelligence solutions for the minerals industry globally.\n\n[www.reflexnow.com/company/imdex-limited](http://www.reflexnow.com/company/imdex-limited)\n\n### JKTech[](#JKTech)\n\nJKTech delivers economic and social value to the global resources industry via high-end technology products and services in ore characterisation and process improvement within all areas of the life-of-mine cycle including geology, mining, mineral processing and sustainability. As the technology transfer company for the Sustainable Minerals Institute (SMI) at The University of Queensland, JKTech has access to leading edge technologies and methodologies.\n\n[www.jktech.com.au](http://www.jktech.com.au)\n\n### METS Ignited[](#METS_Ignited)\n\nMETS Ignited is an industry-led, government-funded, Growth Centre for the mining equipment, technology and services (METS) sector, established to enhance the competitive advantage of the Australian METS sector. It is an independent body tasked to foster collaboration, innovation and commercialisation opportunities across the mining ecosystem and to strengthen Australia’s position as a global hub for mining.\n\n[www.metsignited.org](http://www.metsignited.org)\n\n### METSO[](#METSO)\n\nMetso is an industrial company offering equipment and services for the sustainable processing and flow of natural resources in the mining, aggregates, recycling and process industries. It brings knowledge and innovative solutions to help its customers improve their operational efficiency, reduce risks and increase profitability. Metso employs over 12,000 people in more than 50 countries.\n\nwww.metso.com\n\n### Orica[](#Orica)\n\nOrica is the largest provider of commercial explosives and blasting systems to the mining and infrastructure markets, the global leader in the provision of ground support in mining and tunnelling and the leading supplier of sodium cyanide for gold extraction. Orica is focused on developing long term partnerships which reduce total cost of mining, improve productivity and enhance your licence to operate. The focus of Orica’s global R&D and Technical networks is on the technology transfer of differential blasting activities linked to Grade Engineering®.\n\n[www.orica.com](http://www.orica.com)\n\n### Sodern[](#Sodern)\n\nSodern develops cutting edge technology and has a track record of constantly bringing innovation-based solutions to the market. In the mining sector its primary technology is focused on the elemental analysis of raw materials, for quality, optimisation and profitability. Increasingly efficient technologies have been developed to analyse the composition of raw materials either on line (CNA), or downhole (FastGradeTM ), thus making it possible to optimise the mining process instantly. Through its penetration capacity, neutron based technology allows the analysis of several tonnes of material in real time.\n\n[www.sodern.com](http://www.sodern.com)"},"image":null},"intro":{"text":""},"orderNumber":null},{"__typename":"Platform_Page","id":"65d2edb6ebf7bb9388ffb011","name":"LIBS Sensor","path":"/appendices/wikiore-libs-sensor","slug":"wikiore-libs-sensor","title":null,"subtitle":null,"pretitle":null,"openGraph":{"description":{"text":"Table of contents:\n\n* [P2-004 LIBS Sensor](/pages/wikiore-p-2-004-libs-sensor)\n \n* [P2-006 Cross-Belt Mineralogical Characterisation using LIBS](/pages/wikiore-p-2-006-cross-belt-mineralogical-characterisation-using-libs)"},"image":null},"intro":{"text":""},"orderNumber":null},{"__typename":"Platform_Page","id":"65d2edb6ebf7bb9388ffb01c","name":"P1-012 On Belt Gamma Activation Analysis Demonstration Sensing for Gold","path":"/appendices/wikiore-p-1-012-on-belt-gamma-activation-analysis-demonstration-sensing-for-gold","slug":"wikiore-p-1-012-on-belt-gamma-activation-analysis-demonstration-sensing-for-gold","title":null,"subtitle":null,"pretitle":null,"openGraph":{"description":{"text":" [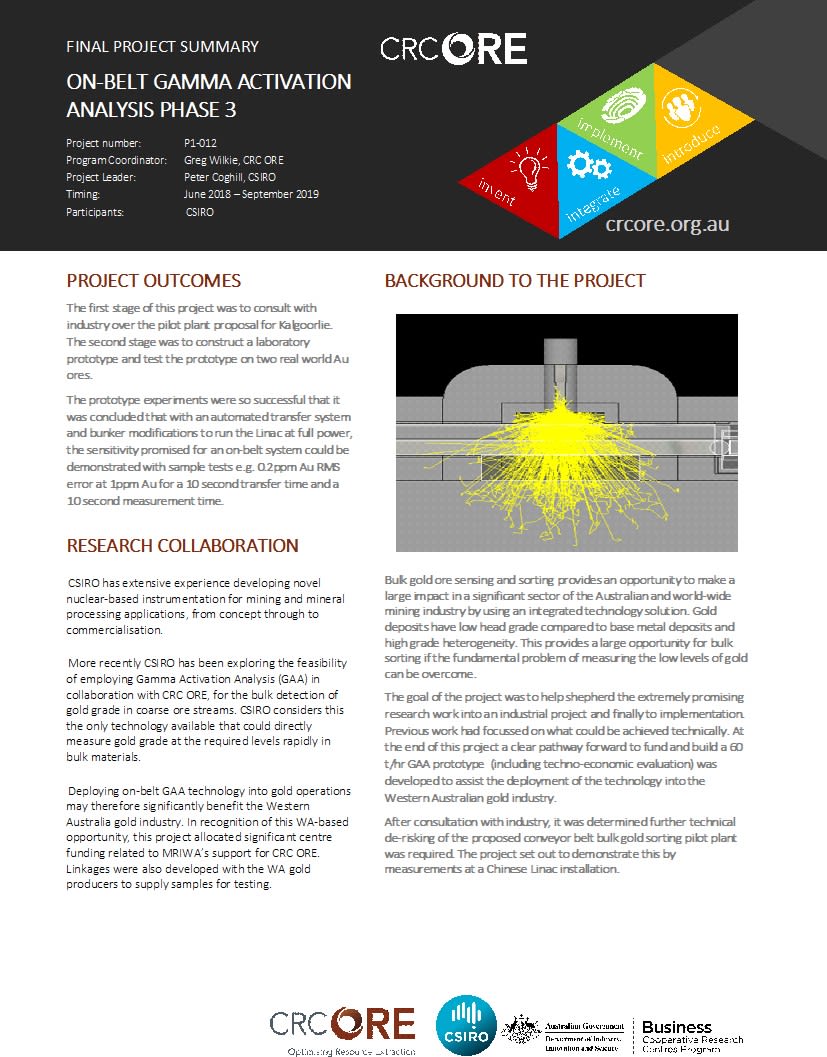](https://res.cloudinary.com/shapeable/image/upload/v1687316274/wikiore/215.jpg)"},"image":null},"intro":{"text":""},"orderNumber":null},{"__typename":"Platform_Page","id":"65d2edb6ebf7bb9388ffb023","name":"Participants: Mining Companies","path":"/appendices/wikiore-participants-3-a-mining-companies","slug":"wikiore-participants-3-a-mining-companies","title":null,"subtitle":null,"pretitle":null,"openGraph":{"description":{"text":"### Anglo American[](#Anglo_American)\n\nAnglo American is a globally diversified mining business. Anglo American’s people are at the heart of their business. Their people use the latest technologies to find new resources, plan and build our mines and who mine, process and move and market our products – from diamonds (through De Beers) to platinum and other precious metals and copper – to customers around the world. Anglo American works together with key partners and stakeholders to unlock the long-term value that those resources represent for shareholders, and for the communities and countries in which they operate – creating sustainable value.\n\n[www.angloamerican.com](http://www.angloamerican.com)\n\n### AngloGold Ashanti[](#AngloGold_Ashanti)\n\nAngloGold Ashanti is the third-largest gold mining company in the world, by production. It has 17 gold mines in nine countries, as well as several exploration programs in both the established and new gold producing regions of the world. With a portfolio of many assets and differing ore body types in key gold producing regions, AngloGold Ashanti’s operations are supported by extensive exploration activities. AngloGold has joined CRC ORE as part of its broader strategy of positioning the company for future growth. The organisation is keenly focused on ensuring the most efficient day-to-day operation of the business, whilst also keep an eye on creating a competitive pipeline of long-term opportunities.\n\n[www.anglogoldashanti.com](http://www.anglogoldashanti.com)\n\n### BHP[](#BHP)\n\nBHP is the world’s largest mining company, BHP brings over 100 years’ experience in the industry with a portfolio of operations and projects which spans every commodity and continent. BHP is among the world’s top producers of major commodities including iron ore, metallurgical coal, copper and uranium, and also with substantial interests in oil, gas and energy coal. BHP extracts and processes minerals, oil and gas from production operations located primarily in Australia and the Americas. Products are sold worldwide, with sales and marketing led through Singapore and Houston, United States. The company aims to maximise the social and economic benefits of their operations, contribute to economic development and minimise their environmental footprint through innovation, productivity and technology.\n\n[www.bhp.com](http://www.bhp.com)\n\n### Newcrest[](#Newcrest)\n\nNewcrest is one of the world’s largest gold mining companies and operates mines in four countries. Newcrest’s focus is on long-term value creation with an emphasis on three key value drivers: maintaining low costs, growing reserves and production and using capital efficiently. Its mission is to deliver superior returns from finding, developing and operating gold/copper mines and vision is to be the Miner of choice™.\n\n[www.newcrest.com.au](http://www.newcrest.com.au)\n\n### Glencore[](#Glencore)\n\nGlencore has operated in Australia for nearly 20 years and holds significant interests in a range of commodity industries across all mainland states and the Northern Territory. Headquartered in Sydney, we are a major Australian employer, with about 16,000 people working across industries that include coal, copper, zinc, nickel, oil and agricultural products.\n\n[www.glencore.com.au](http://www.glencore.com.au)\n\n### Teck[](#Teck)\n\nTeck is Canada’s largest diversified resources company. Teck’s portfolio includes copper, steelmaking, zinc, energy and coal operations across North America, Peru and Chile. Teck is a diversified resource company committed to responsible mining and mineral development and is focused on providing products that are essential to building a better quality of life for people around the globe.\n\n[www.teck.com](http://www.teck.com)\n\n### Summit Mining International[](#Summit_Mining_International)\n\nSummit Mining International is a wholly owned subsidiary of Sumitomo Corporation known for developing and employing innovative technology, via its global network, of high-quality materials such as non-ferrous metals, electronics and advanced materials. Summit’s operations are underpinned by the principles of compliance, environmental protection, operational safety and fulfilling its social responsibilities as a manufacturing enterprise.\n\n[www.summitmininginternational.com](http://www.summitmininginternational.com)"},"image":null},"intro":{"text":""},"orderNumber":null},{"__typename":"Platform_Page","id":"65d2edb6ebf7bb9388ffb01a","name":"P1-007 Surface Techniques for Geosensing","path":"/appendices/wikiore-p-1-007-surface-techniques-for-geosensing","slug":"wikiore-p-1-007-surface-techniques-for-geosensing","title":null,"subtitle":null,"pretitle":null,"openGraph":{"description":{"text":" [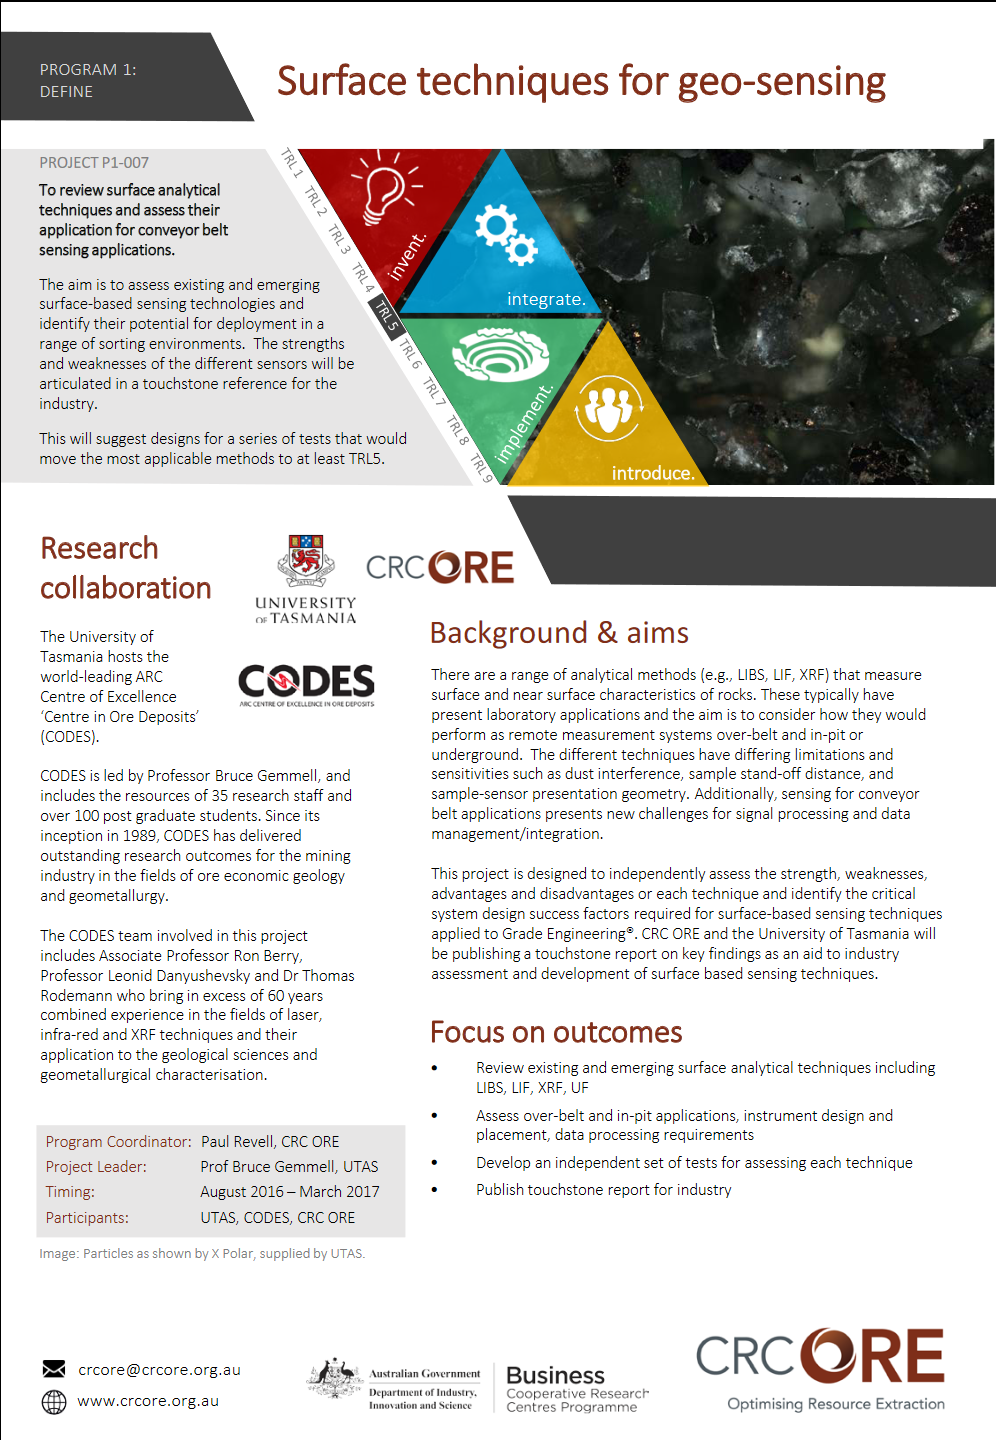](https://res.cloudinary.com/shapeable/image/upload/v1687316260/wikiore/284.png)"},"image":null},"intro":{"text":""},"orderNumber":null},{"__typename":"Platform_Page","id":"65d2edb6ebf7bb9388ffaff5","name":"Activity 3: Bulk Sorting","path":"/appendices/wikiore-activity-3-bulk-sorting","slug":"wikiore-activity-3-bulk-sorting","title":null,"subtitle":null,"pretitle":null,"openGraph":{"description":{"text":"This activity covers the determination of Bulk Sorting potential from a set of UC populated blocks. From the supplied set of data determine both the original and Bulk Sorting grade tonnage results. Assuming the same cut-off grade, does sorting increase metal produced?\n\n* * *\n\n**Activity 3 Notes:**\n\n* Cut-off grades here are calculated by greater than or equal to the value\n* Calculating tonnages in the sorting case needs to reflect the different masses being accepted from each block\n* Grades need to be weighted to the relevant mass\n* RR values here are for relative upgrades at fixed points and will not adhere to a normal curve shape\n * Each cut-off grade can produce different relative upgrades\n* What would the important metrics be when comparing the sorting and no sorting cases?\n\n* * *\n\n[Click here to return to Bulk Sorting Characterisation](/sub-topics/bulk-sorting-characterisation)\n\n* * *\n\n[Click here to proceed to the next Activity on Particle Sorting](/pages/wikiore-activity-4-particle-sorting)"},"image":null},"intro":{"text":""},"orderNumber":null},{"__typename":"Platform_Page","id":"65d2edb6ebf7bb9388ffaff9","name":"Appendix A: Activities","path":"/appendices/wikiore-appendix-a-activities","slug":"wikiore-appendix-a-activities","title":null,"subtitle":null,"pretitle":null,"openGraph":{"description":{"text":"Each following activity aids in understanding how to evaluate and apply Grade Engineering. Sets of specific activities cover different facets of conducting a Grade Engineering Opportunity Assessement.\n\n* * *\n\n**Grade Engineering Lever Characterisation**\n\n[Download the Activities](https://res.cloudinary.com/shapeable/raw/upload/v1687316079/wikiore/166.php)\n\n[Activity 1: Natural Deportment](/pages/wikiore-activity-1-natural-deportment) | [Activity 2: Induced Deportment](/pages/wikiore-activity-2-induced-deportment)\n\n[Activity 3: Bulk Sorting](/pages/wikiore-activity-3-bulk-sorting) | [Activity 4: Particle Sorting](/pages/wikiore-activity-4-particle-sorting) | [Activity 5: Gravity Separation](/pages/wikiore-activity-5-gravity-separation)\n\n[](https://res.cloudinary.com/shapeable/image/upload/v1687316080/wikiore/165.jpg)"},"image":null},"intro":{"text":""},"orderNumber":null},{"__typename":"Platform_Page","id":"65d2edb6ebf7bb9388ffaff7","name":"Activity 5: Gravity Separation","path":"/appendices/wikiore-activity-5-gravity-separation","slug":"wikiore-activity-5-gravity-separation","title":null,"subtitle":null,"pretitle":null,"openGraph":{"description":{"text":"For this activity a set of GRAT sink/float test masses and assays have been provided. From this calculate the best density separation point. Should the fines be added to the accept or reject stream in this best case?\n\n* * *\n\n[Click here to return to Gravity Separation Characterisation](/sub-topics/gravity-separation-characterisation)\n\n* * *\n\n[Click here to return to the Activities Page](/pages/wikiore-appendix-a-activities)"},"image":null},"intro":{"text":""},"orderNumber":null},{"__typename":"Platform_Page","id":"65d2edb6ebf7bb9388ffb00d","name":"Induced Deportment","path":"/appendices/wikiore-induced-deportment","slug":"wikiore-induced-deportment","title":null,"subtitle":null,"pretitle":null,"openGraph":{"description":{"text":"**[Natural Deportment](/pages/wikiore-natural-deportment) | [Induced Deportment](/pages/wikiore-induced-deportment) | [Bulk Sorting](/pages/wikiore-bulk-sorting) | [Particle Sorting](/pages/wikiore-particle-sorting) | [Gravity Separation](/pages/wikiore-gravity-separation)**\n\n[Induced deportment](/pages/wikiore-induced-deportment) is the ability to condition sub-volumes of feed material separately through careful application of energy. [differential blasting](/pages/wikiore-induced-deportment) involves conditioning sub-volumes of material at bench or [stope](https://en.wikipedia.org/wiki/Stoping) scale using customised blast designs that generate imposed size distributions with higher grade concentrated in finer fractions. amenability is a function of [heterogeneity](/pages/wikiore-heterogeneity) at bench hole scale linked to the ability to impose and control different energy distributions within a blast design. As with [natural deportment](/pages/wikiore-natural-deportment), separation is achieved via screening of post-blast material.\n\n \nFor Characterisation methods for Induced Deportment click [HERE](/sub-topics/induced-deportment-characterisation).\n\n \n\n[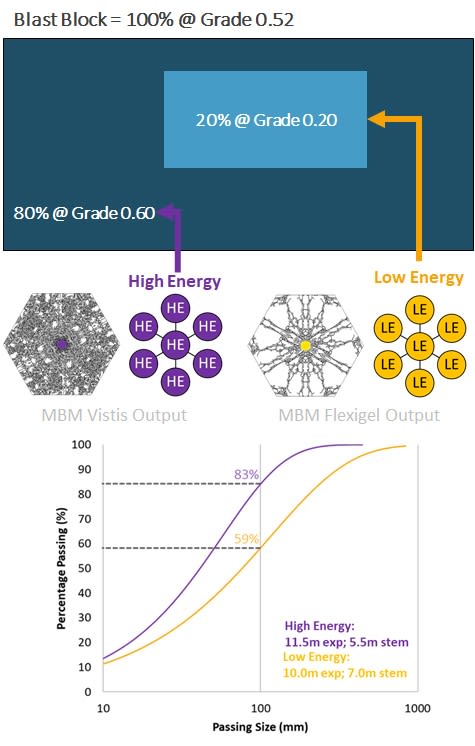](https://res.cloudinary.com/shapeable/image/upload/v1687306200/wikiore/41.jpg)"},"image":null},"intro":{"text":""},"orderNumber":null},{"__typename":"Platform_Page","id":"65d2edb6ebf7bb9388ffb010","name":"Introduction to Grade Engineering","path":"/appendices/wikiore-introduction-to-grade-engineering","slug":"wikiore-introduction-to-grade-engineering","title":null,"subtitle":null,"pretitle":null,"openGraph":{"description":{"text":"[](https://res.cloudinary.com/shapeable/image/upload/v1687306182/wikiore/138.jpg)\n\nA focus on throughput as the main driver of revenue has led to a bulk average mentality with respect to In-situ [cut-off](/sub-topics/scheduling-and-cut-off-optimisation) grades. In many cases average grades used to define bench or [stope](https://en.wikipedia.org/wiki/Stoping) scale processing destination decisions such as mill, [dump leach](https://en.wikipedia.org/wiki/Heap_leaching), waste, etc. include significant sub-volumes of material outside [cut-off](/sub-topics/scheduling-and-cut-off-optimisation) specifications. An averaging approach ignores potentially exploitable grade [heterogeneity](/pages/wikiore-heterogeneity) below the scale of minimum mining unit even though significant localised grade [heterogeneity](/pages/wikiore-heterogeneity) is a dominant characteristic of many base and metal deposit styles and ore types.\n\nLocalised grade [heterogeneity](/pages/wikiore-heterogeneity) is typically overlooked in favor of maximising extraction rates and loading efficiency. This is coupled with a desire to blend ROM and produce steady state feed in terms of grade and physical properties to optimise and maximise recovery of saleable product particularly in crush-grind-float operations. Where blended supply of ‘averaged’ feed struggles to achieve steady state processing stability, this is a first order indication that significant [heterogeneity](/pages/wikiore-heterogeneity) exists within a resource that could be exploited rather than suppressed.\n\n[Grade Engineering](/pages/wikiore-introduction-to-grade-engineering)® recognises that in many cases out of specification sub-volumes assigned to destinations based on bulk averages can be removed using efficient coarse separation techniques in the ‘dig and deliver’ interface. coarse separation (~10-100mm) can be used on a range of [particle size](https://en.wikipedia.org/wiki/Particle_size) distributions ranging from ROM to SAG discharge. The earlier this occurs in the conventional dig and deliver mining cycle the higher the potential net value of removing uneconomic material.\n\nEvery handling and size transformation interface in the dig and deliver cycle should be considered an opportunity for applying coarse separation. ROM and post primary [crushing](https://en.wikipedia.org/wiki/Crusher) are obvious intervention points with opportunity for separation conditioning during modified blast design. The decision to intervene is a function of grade [heterogeneity](/pages/wikiore-heterogeneity) in a given parcel of material; the yield-response of a separation device at a specific size reduction point; the ability to change a destination decision for one or more of the new streams following separation; and the net value of the new streams after handling costs.\n\n[Grade Engineering](/pages/wikiore-introduction-to-grade-engineering)® outcomes do not create ‘new’ metal but rather exchange metal from separated components between existing destinations to create improved net value after cost of exchange is considered. This involves exchanging a component of separated mill feed with other destinations such as mineralised waste, [stockpiles](https://en.wikipedia.org/wiki/Stockpile) or [dump leach](https://en.wikipedia.org/wiki/Heap_leaching) with low recovery. The aim is to bring metal forward from destinations that are not delivering maximum current value.\n\nOverall metal exchange balance can be modified to suit operational modes or [bottlenecks](https://en.wikipedia.org/wiki/Bottleneck_%28production%29). This can include keeping the concentrator full with improved grades or deferring the need for expanding installed capacity. mass pull on separation devices can be used to control accept/reject tonnages and resulting upgrades. While [Grade Engineering](/pages/wikiore-introduction-to-grade-engineering)® does not create ‘new metal’, outcomes improve resource to reserve conversion by potentially separating economic parcels of ore from mineralised waste.\n\nThe concept of coarse separation or pre-concentration is not new and has been practiced from the beginning of mining as hand picking. The propensity of some ores to break preferentially during blasting and [crushing](https://en.wikipedia.org/wiki/Crusher) leading to an increase of valuable phases in finer fractions has also been widely known but rarely exploited at production scale . A notable exception was pre-concentration carried out in the 1980’s at the [Bougainville](https://en.wikipedia.org/wiki/Panguna_mine) Copper Limited Panguna Cu-Au mine in Papua New Guinea. This involved a [screening plant](https://en.wikipedia.org/wiki/Mechanical_screening) to upgrade marginal low grade ROM ores (0.22 Cu, 0.18 g/t Au) that exhibited preferential grade deportment into fines . The plant had a capacity of 35 Mt p.a. at a <32mm screening size, which produced a 50% Cu-Au upgrade in 38% retained mass.\n\nAdditional examples of production scale pre-concentration include the Dense Media Plant at Mount Isa Mines which removes ~35% of coarse and hardest Pb-Zn feed before the fine [grinding](https://en.wikipedia.org/wiki/Mill_%28grinding%29) treatment process. This increases throughput , reduces capital intensity in the [comminution](https://en.wikipedia.org/wiki/Comminution) circuit , and reduces energy requirement per unit metal in the concentrator by >40%, together with a 15% improvement of grade in the retained stream.\n\nWhile application of sensor-based sorting has found widespread application in industrial recycling and food quality management, there are limited examples of routine application to pre-concentration in the minerals industry . An exception is the Mittersill tungsten mine in Austria where in response to head grades falling from 0.7% to 0.2% since mining commenced in 1976, X-ray Transmission sensor-based particle sorting units were installed in 2008. The results significantly increased effective head grade and reduced energy intensity while allowing rejected waste to be sold as road aggregate.\n\nAlthough there are global examples of coarse pre-concentration generating value for some base and precious metal mining operations, there is no coherent system-based industry approach or standard methodology to assess optimal configurations for selecting specific technologies or equipment to deliver maximum value for specific ores and operational constraints.\n\n[Grade Engineering](/pages/wikiore-introduction-to-grade-engineering)® is the first large-scale initiative to focus on integrated methodologies to deliver maximum operational value. The prime aim for CRC ORE is to deliver [Grade Engineering](/pages/wikiore-introduction-to-grade-engineering)® as an industry standard methodology designed to improve productivity and value to mining operations which includes the ability to filter and rank individual operations for highest opportunity.\n\n \n \n\nGrade Engineering consists of five key technology/technique levers;\n\n**[Natural Deportment](/pages/wikiore-natural-deportment) | [Induced Deportment](/pages/wikiore-induced-deportment) | [Bulk Sorting](/pages/wikiore-bulk-sorting) | [Particle Sorting](/pages/wikiore-particle-sorting) | [Gravity Separation](/pages/wikiore-gravity-separation)**\n\n \n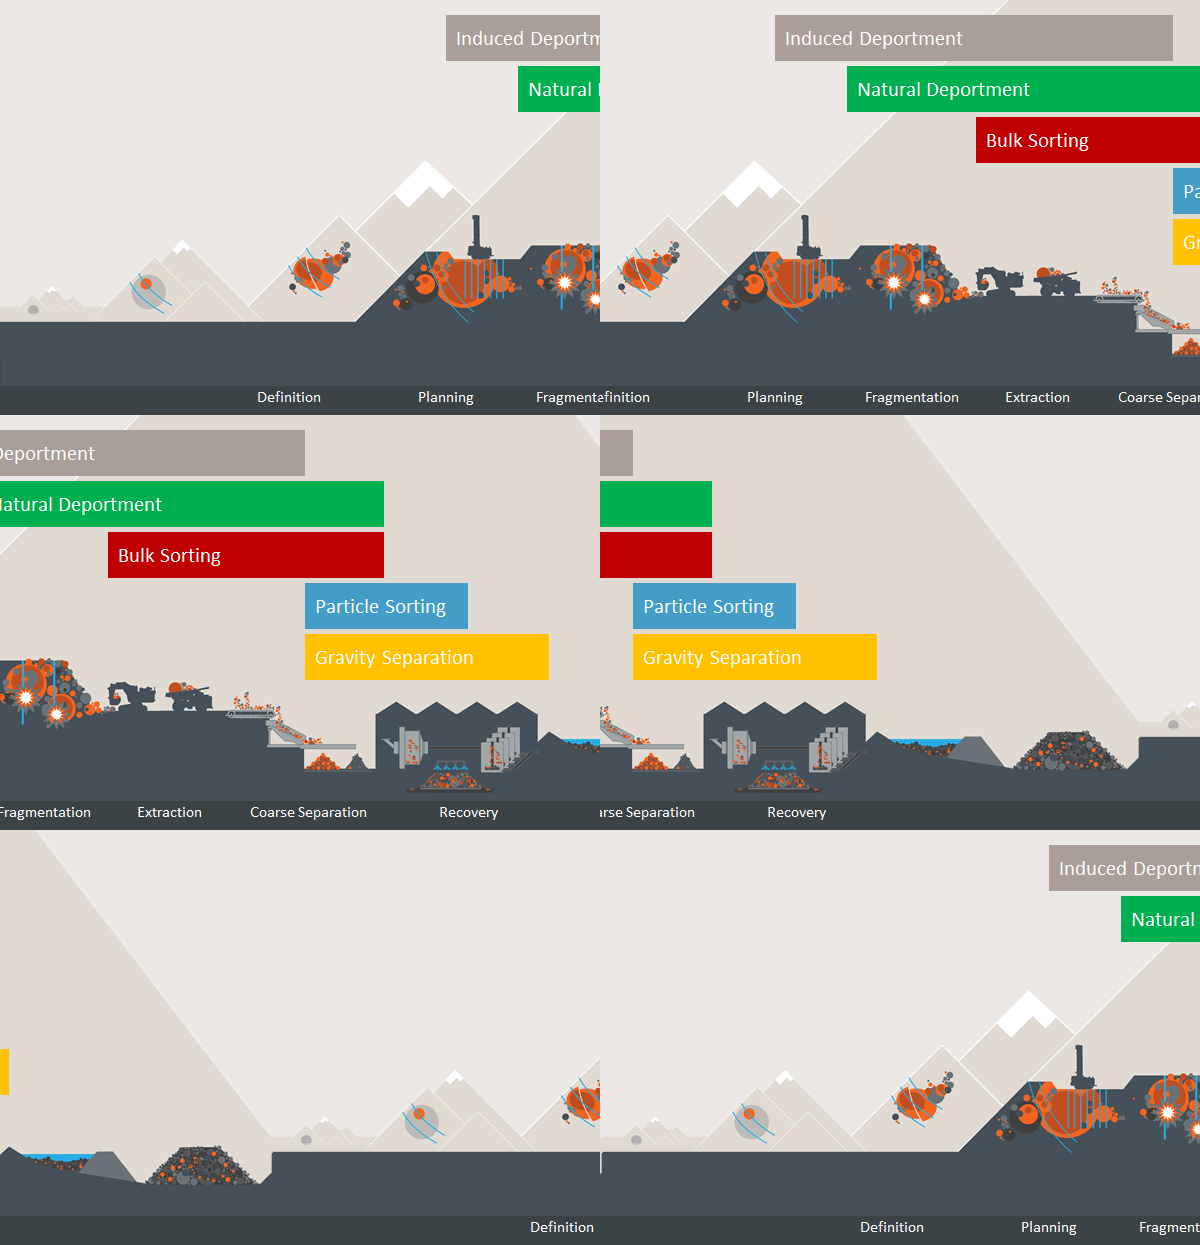\n\nEach lever naturally integrates with the mining value chain at one or more points. Some levers can be competitive while others complementary.\n\nOne such example of complementary levers is the integration of Particle Sorting with Natural Deportment, referred to as Integrated Screening and Particle Sorting (ISPS) within CRC ORE.\n\n \n \n \n\n* * *\n\n* * *\n\n[Return to Homepage](/pages/wikiore-homepage)"},"image":null},"intro":{"text":""},"orderNumber":null},{"__typename":"Platform_Page","id":"65d2edb6ebf7bb9388ffb007","name":"Gravity Separation","path":"/appendices/wikiore-gravity-separation","slug":"wikiore-gravity-separation","title":null,"subtitle":null,"pretitle":null,"openGraph":{"description":{"text":"**[Natural Deportment](/pages/wikiore-natural-deportment) | [Induced Deportment](/pages/wikiore-induced-deportment) | [Bulk Sorting](/pages/wikiore-bulk-sorting) | [Particle Sorting](/pages/wikiore-particle-sorting) | [Gravity Separation](/pages/wikiore-gravity-separation)**\n\n[gravity separation](https://en.wikipedia.org/wiki/Gravity_separation) involves using heavy media separation and in-line pressure jigs at coarse scale (>10mm) generating individual particle separations based on density. amenability and separation outcomes are a function of texture and mineralogy at this scale. Conditioning feed for coarse [gravity separation](https://en.wikipedia.org/wiki/Gravity_separation) typically requires secondary [crushing](https://en.wikipedia.org/wiki/Crusher) and screening to deliver a carefully constrained [particle size](https://en.wikipedia.org/wiki/Particle_size) distribution. For this reason, coarse [gravity separation](https://en.wikipedia.org/wiki/Gravity_separation) in [Grade Engineering](/pages/wikiore-introduction-to-grade-engineering)® applications primarily operates as a ‘cleaner’ in combination with streams derived using other levers.\n\n \n \nFor Characterisation methods for Gravity Separation click [HERE](/sub-topics/gravity-separation-characterisation).\n\n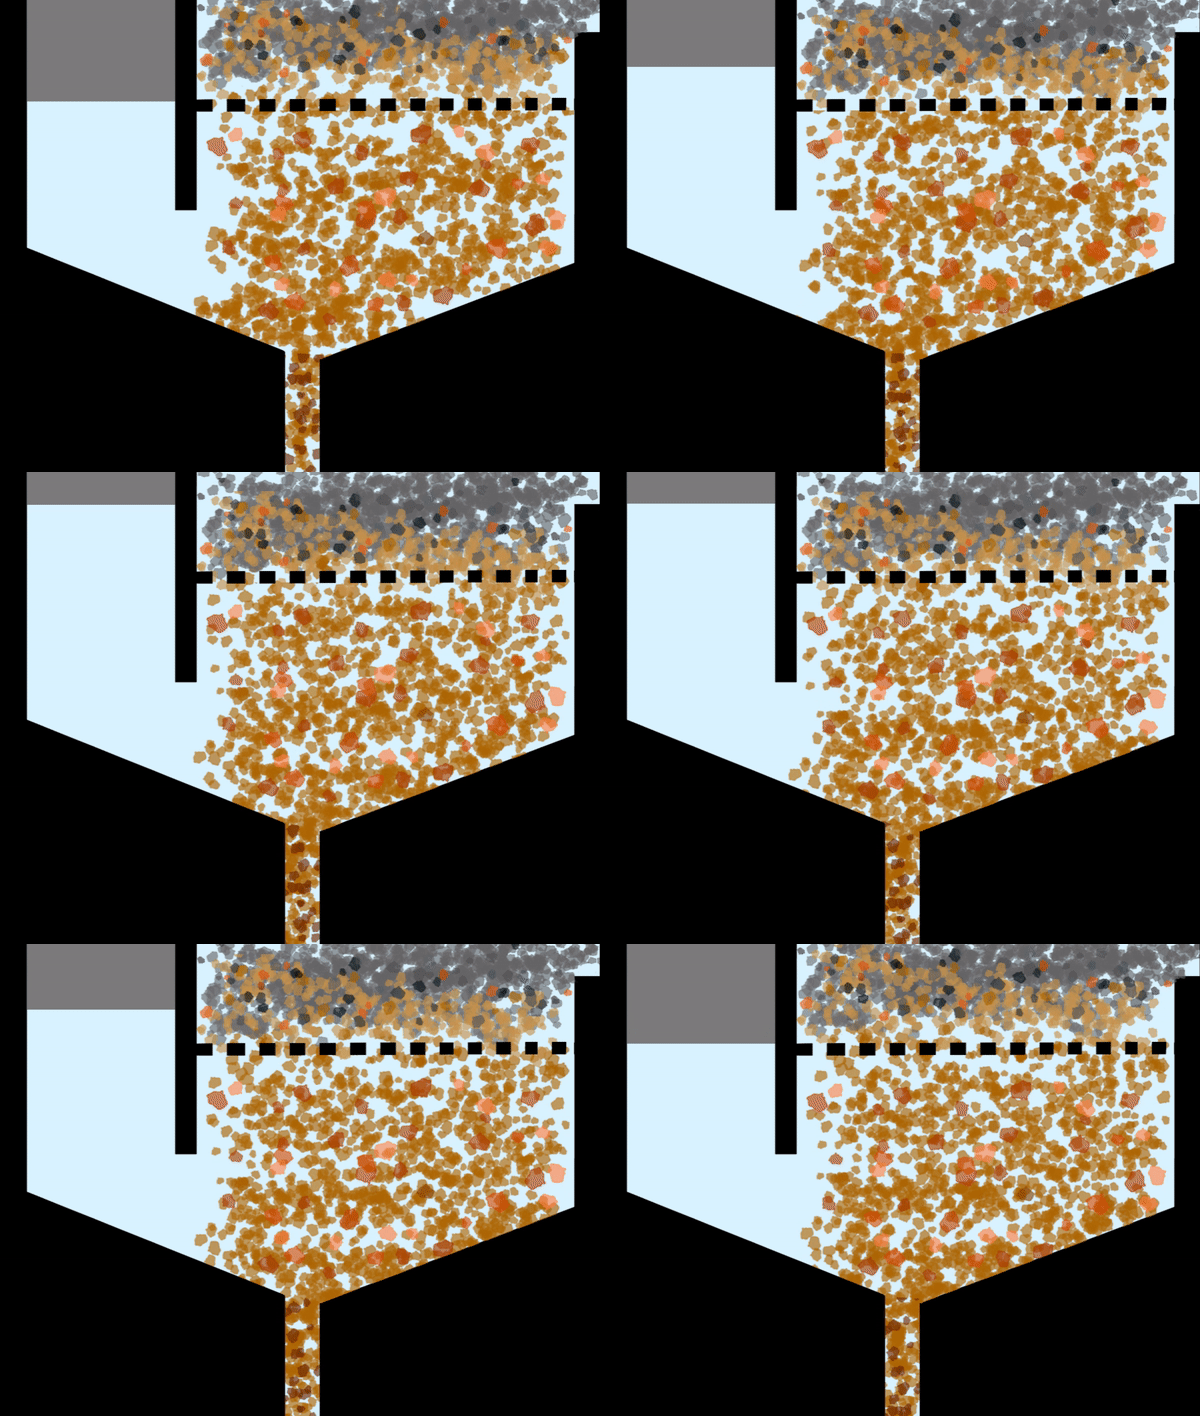\n\n \n\n [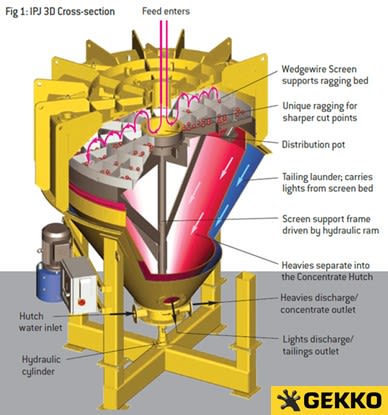](https://res.cloudinary.com/shapeable/image/upload/v1687306222/wikiore/44.jpg) \n\n[Next Chapter 4: Grade Engineering Studies](/topics/grade-engineering-studies)"},"image":null},"intro":{"text":""},"orderNumber":null},{"__typename":"Platform_Page","id":"65d2edb6ebf7bb9388ffb00b","name":"Homepage","path":"/appendices/wikiore-homepage","slug":"wikiore-homepage","title":null,"subtitle":null,"pretitle":null,"openGraph":{"description":{"text":"\n\nThe Cooperative Research Centre for Optimising Resource Extraction (CRC ORE) was a not for profit organisation funded by the Australian Federal Government and the global minerals industry . CRC ORE commenced in mid-2010 and after its initial 5-year funding term, was awarded a further 6-years of funding until July 2021. \n \nCRC ORE aimed to transform the minerals sector by deploying innovative world-class technology to affect a step change in value across the whole-of-mine system. It sought to ‘Optimise Resource Extraction’ through site implementation of innovation to improve overall productivity. \n \nCRC ORE has achieved support of over $160M in investment to achieve critical mass and capacity. This includes $34.4m in federal funding, with the remaining investment through Mining, METS and Research participants. CRC ORE was focused on radically improving the productivity, energy and water signatures of our mining operations and reversing the ‘conventional wisdom’ of grade decline through new [gangue](https://en.wikipedia.org/wiki/Gangue) rejection techniques.\n\n \nIn November 2020, global multidisciplinary management, engineering and development consultancy Hatch was awarded an exclusive licence to commercialise Grade Engineering® Consulting Services.\n\nFor all enquiries regarding Grade Engineering consulting services, please contact Hugh Sherman, Process Engineer, Mining and Minerals Processing, Hatch: [hugh.sherman@hatch.com](mailto:hugh.sherman@hatch.com)\n\n \n \n\n[](https://res.cloudinary.com/shapeable/image/upload/v1687306226/wikiore/330.gif)\n\n* * *\n\nMore information can be found at these links: [CRC ORE](/pages/wikiore-introduction-to-crc-ore), [Heterogeneity](/pages/wikiore-heterogeneity), [Grade Engineering](/pages/wikiore-introduction-to-grade-engineering)\n\n* [Homepage](/pages/wikiore-homepage)\n \n* [Introduction to CRC ORE](/pages/wikiore-introduction-to-crc-ore)\n \n * [Participants: Mining Companies](/pages/wikiore-participants-3-a-mining-companies)\n \n * [Participants: Mining Engineering Technology Suppliers (METS)](/pages/wikiore-participants-3-a-mining-engineering-technology-suppliers-28-mets-29)\n \n * [Participants: Research Organisations](/pages/wikiore-participants-3-a-research-organisations)\n \n * [Participants: METS Associates](/pages/wikiore-participants-3-a-mets-associates)\n \n * [Staff](/pages/wikiore-staff)\n \n * [Students](/pages/wikiore-students)\n \n* [Introduction to Grade Engineering](/pages/wikiore-introduction-to-grade-engineering)\n \n * [Natural Deportment](/pages/wikiore-natural-deportment)\n \n * [Induced Deportment](/pages/wikiore-induced-deportment)\n \n * [Bulk Sorting](/pages/wikiore-bulk-sorting)\n \n * [Particle Sorting](/pages/wikiore-particle-sorting)\n \n * [Gravity Separation](/pages/wikiore-gravity-separation)\n \n* [Heterogeneity](/pages/wikiore-heterogeneity)"},"image":null},"intro":{"text":""},"orderNumber":null},{"__typename":"Platform_Page","id":"65d2edb6ebf7bb9388ffb016","name":"Opportunity Assessments","path":"/appendices/wikiore-22-opportunity-assessments","slug":"wikiore-22-opportunity-assessments","title":null,"subtitle":null,"pretitle":null,"openGraph":{"description":{"text":"[Grade Engineering](/pages/wikiore-introduction-to-grade-engineering)® is the integration of dynamic pre-concentration techniques within an operation and the strategies to employ to maximise the value of the operation over the life of the mine. A [Grade Engineering](/pages/wikiore-introduction-to-grade-engineering) [opportunity assessment](/sub-topics/opportunity-assessments) is a high-level, technical and economic evaluation of potential pre-concentration opportunities at an existing operation or proposed project. The aim of the [opportunity assessment](/sub-topics/opportunity-assessments) is to:\n\n1. identify [Grade Engineering](/pages/wikiore-introduction-to-grade-engineering) techniques and strategies that are technically feasible and add value,\n2. provide an order of magnitude estimate of the [net present value](https://en.wikipedia.org/wiki/Net_present_value) from [Grade Engineering](/pages/wikiore-introduction-to-grade-engineering), and\n3. determine if there is justification to pursue detailed [Grade Engineering](/pages/wikiore-introduction-to-grade-engineering) studies at the operation/project.\n\n**An [opportunity assessment](/sub-topics/opportunity-assessments) is:**\n\n**An [opportunity assessment](/sub-topics/opportunity-assessments) is not:**\n\nThe first step\n\nThe final answer\n\nA preliminary assessment designed to quickly establish if there is an opportunity to pursue detailed [Grade Engineering](/pages/wikiore-introduction-to-grade-engineering) studies\n\nThe definitive cost estimate of equipment and detailed standard operating procedures to implement [Grade Engineering](/pages/wikiore-introduction-to-grade-engineering) at an operation\n\nAn order of magnitude estimate of [NPV](https://en.wikipedia.org/wiki/Net_present_value) from [Grade Engineering](/pages/wikiore-introduction-to-grade-engineering) within the constraints of the existing strategic mine plan, [ultimate pit](/sub-topics/ultimate-pit-and-pushbacks), underground excavation, phases and schedule\n\nA definitive estimate of [NPV](https://en.wikipedia.org/wiki/Net_present_value) using integrated simulations and optimisation of the strategic mine plan, processing flowsheets, [ultimate pit](/sub-topics/ultimate-pit-and-pushbacks), phases and schedule incorporating [Grade Engineering](/pages/wikiore-introduction-to-grade-engineering)\n\nA desktop study with supporting laboratory testing for the preliminary characterisation of upgrade responses in [geomet](https://en.wikipedia.org/wiki/Geometallurgy)allurgical domains\n\nThe complete characterisation of the deposit with geostatistical interpolated upgrade responses in the resource model\n\nThe examination of a wide range of [Grade Engineering](/pages/wikiore-introduction-to-grade-engineering) techniques and operating strategies to identify those which add value to the project\n\nThe detailed examination of the definitive [Grade Engineering](/pages/wikiore-introduction-to-grade-engineering) technique and operating strategy to maximise the value of the project\n\n2-3 month project\n\n6-12 month project\n\nCRC ORE employs a staged approach in the evaluation and implementation of [Grade Engineering](/pages/wikiore-introduction-to-grade-engineering) techniques and strategies at an operation. A [Grade Engineering](/pages/wikiore-introduction-to-grade-engineering) [opportunity assessment](/sub-topics/opportunity-assessments) is the starting point for these evaluations. The [opportunity assessment](/sub-topics/opportunity-assessments) is a desktop evaluation with supporting laboratory testing for the preliminary characterisation of potential upgrade responses in [geomet](https://en.wikipedia.org/wiki/Geometallurgy)allurgical domains of the deposit. It is designed to rapidly evaluate a wide range of [Grade Engineering](/pages/wikiore-introduction-to-grade-engineering) techniques and strategies within the constraints of the existing strategic mine plan to identify opportunities with the greatest potential to add value to the operation.\n\nIf a [Grade Engineering](/pages/wikiore-introduction-to-grade-engineering) technique shows potential during an [opportunity assessment](/sub-topics/opportunity-assessments), it would be recommended to advance the evaluation to a [Grade Engineering](/pages/wikiore-introduction-to-grade-engineering) [concept study](/topics/grade-engineering-studies). The [concept study](/topics/grade-engineering-studies) provides a stronger estimate of technical and economic viability, greater characterisation of upgrade response s in domain s of the deposit and additional test work to understand the [grade by size](/pages/wikiore-natural-deportment) response of material at bulk scales and with progressive [crushing](https://en.wikipedia.org/wiki/Crusher). The [concept study](/topics/grade-engineering-studies) may include integrated modelling and simulation to assess the impact of pre-concentration and blending activities on mill performance and plant recoveries and the optimisation of the mining schedule to maximise the value of the operation with [Grade Engineering](/pages/wikiore-introduction-to-grade-engineering).\n\nIf a [Grade Engineering](/pages/wikiore-introduction-to-grade-engineering) technique and strategy demonstrates suitable economic and technical [feasibility](https://en.wikipedia.org/wiki/Feasibility_study) in the [concept study](/topics/grade-engineering-studies), it would be recommended to proceed to [Site Trial](/sub-topics/site-trials)s to demonstrate the response of the technology at production scale s and support the revision of the business case, [ultimate pit](/sub-topics/ultimate-pit-and-pushbacks), phases, schedule and strategic mine plan with site expertise and practices. The results of [Site Trial](/sub-topics/site-trials)s and strategic planning would be used to support the decision to proceed to pre-[feasibility](https://en.wikipedia.org/wiki/Feasibility_study)/[feasibility](https://en.wikipedia.org/wiki/Feasibility_study) studies at the required level to support the capital investment. During the [feasibility](https://en.wikipedia.org/wiki/Feasibility_study)study, definitive cost estimates and detailed engineering designs for equipment will be finalised and a decision to implement [Grade Engineering](/pages/wikiore-introduction-to-grade-engineering) at the operation can be made.\n\nNot all material extracted from a deposit will be amenable to [Grade Engineering](/pages/wikiore-introduction-to-grade-engineering) and strategies that treat all amenable ore through [Grade Engineering](/pages/wikiore-introduction-to-grade-engineering) are unlikely to maximise the value of an operation. Economic evaluations must consider the net value of treating a unit of material through [Grade Engineering](/pages/wikiore-introduction-to-grade-engineering) compared to the net value of treating the material directly at a processing destination. This comparison often favours the treatment of marginal material through [Grade Engineering](/pages/wikiore-introduction-to-grade-engineering) techniques. The net value of treating material through [Grade Engineering](/pages/wikiore-introduction-to-grade-engineering) and the strategies that maximise value at an operation are dependent on:\n\n* The strength of upgrade responses in the material,\n* The average grade and grade [heterogeneity](/pages/wikiore-heterogeneity) of the material,\n* The efficiency of equipment used to perform the separation,\n* The production stage and [particle size](https://en.wikipedia.org/wiki/Particle_size) at which the separation can be performed,\n* The cost of separating and rehandling material streams,\n* The benefits and impacts of treating pre-concentrated material streams in downstream destinations,\n* The availability and quality of ore and the capacities and constraints of production.\n\nThe economic evaluations performed during an [opportunity assessment](/sub-topics/opportunity-assessments) are based on the results of value-driven optimisations performed within the constraints of the existing strategic mine plan. If sufficient value can be found within these constraints, advanced [Grade Engineering](/pages/wikiore-introduction-to-grade-engineering) studies can optimise the [ultimate pit](/sub-topics/ultimate-pit-and-pushbacks), [stope](https://en.wikipedia.org/wiki/Stoping)s / draw points, phases, schedule and strategic mine plan incorporating [Grade Engineering](/pages/wikiore-introduction-to-grade-engineering) to further increase the [net present value](https://en.wikipedia.org/wiki/Net_present_value) of the operation."},"image":null},"intro":{"text":""},"orderNumber":null},{"__typename":"Platform_Page","id":"65d2edb6ebf7bb9388ffb01b","name":"P1-009 Gold Ore Sorting Prototype","path":"/appendices/wikiore-p-1-009-gold-ore-sorting-prototype","slug":"wikiore-p-1-009-gold-ore-sorting-prototype","title":null,"subtitle":null,"pretitle":null,"openGraph":{"description":{"text":" [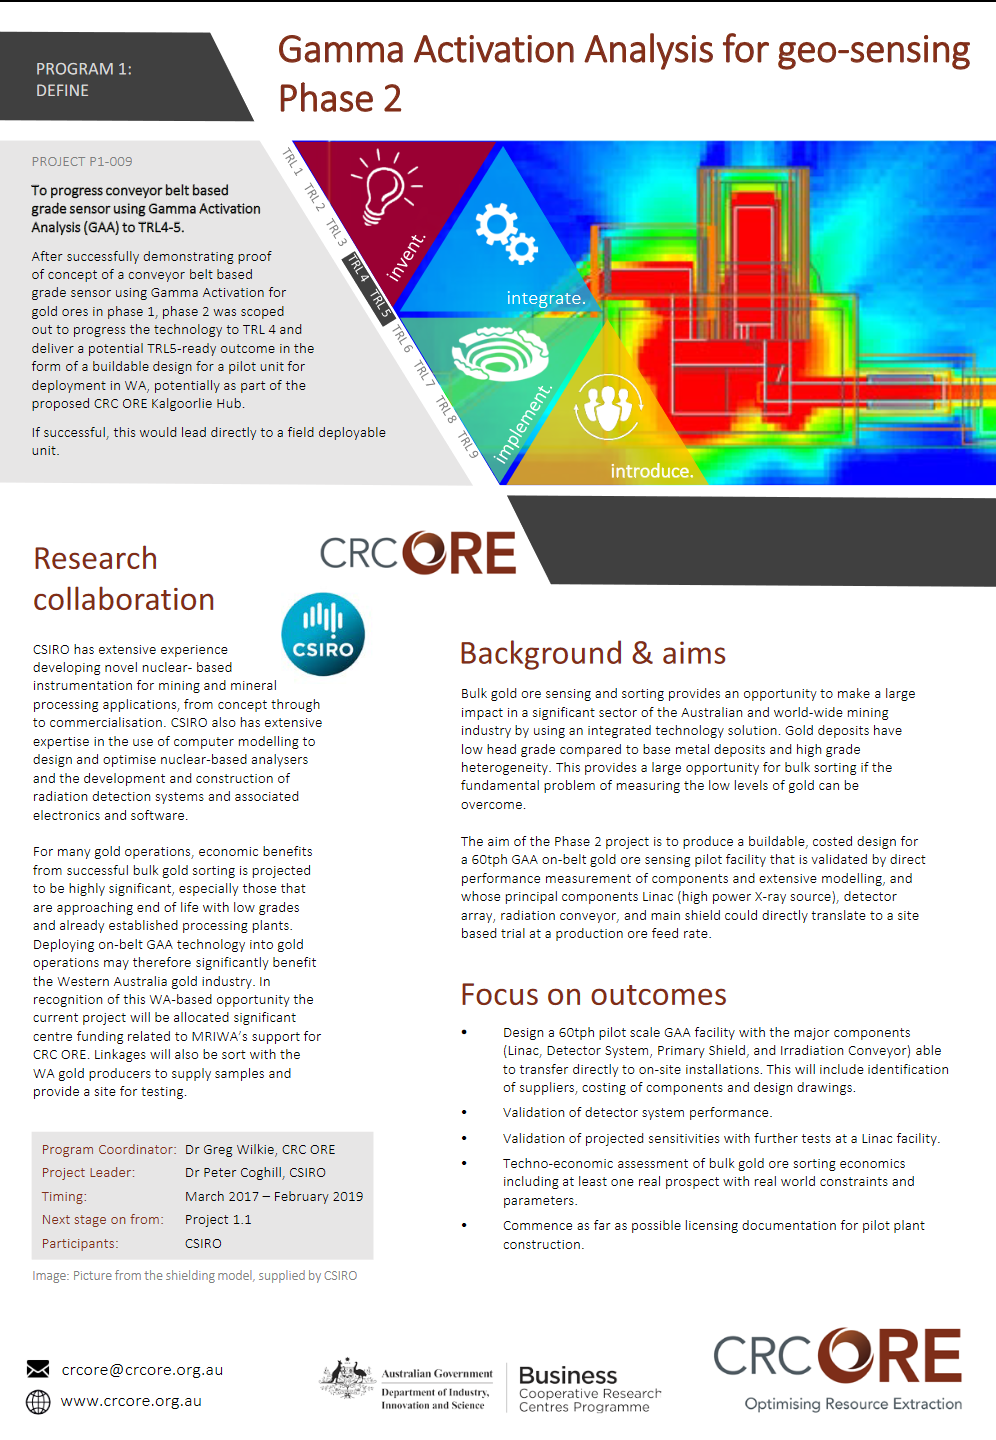](https://res.cloudinary.com/shapeable/image/upload/v1687316269/wikiore/286.png)"},"image":null},"intro":{"text":""},"orderNumber":null},{"__typename":"Platform_Page","id":"65d2edb6ebf7bb9388ffb01e","name":"P2-004 LIBS Sensor","path":"/appendices/wikiore-p-2-004-libs-sensor","slug":"wikiore-p-2-004-libs-sensor","title":null,"subtitle":null,"pretitle":null,"openGraph":{"description":{"text":" [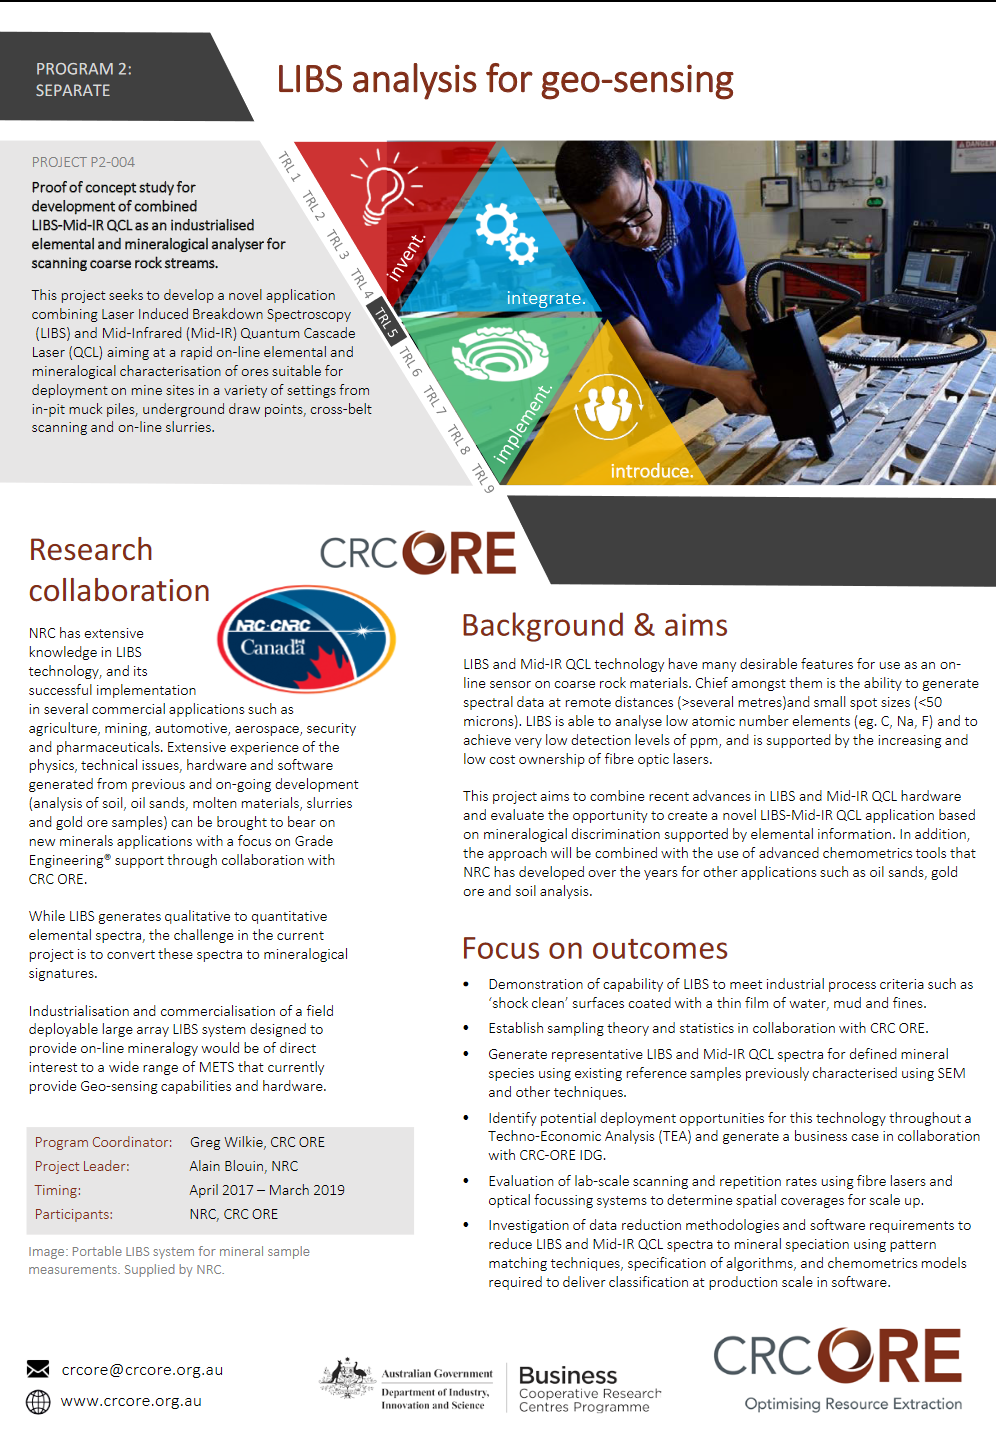](https://res.cloudinary.com/shapeable/image/upload/v1687316276/wikiore/289.png)"},"image":null},"intro":{"text":""},"orderNumber":null},{"__typename":"Platform_Page","id":"65d2edb6ebf7bb9388ffaff6","name":"Activity 4: Particle Sorting","path":"/appendices/wikiore-activity-4-particle-sorting","slug":"wikiore-activity-4-particle-sorting","title":null,"subtitle":null,"pretitle":null,"openGraph":{"description":{"text":"This activity covers the determination of input parameters for the log normal model for particle sorting. 100 particles have been tested from the Monzonite A samples 70mmx45mm fraction from Activity 1. Complete the supplied table to determine relevant grades, mean and mode for this sample.\n\n[Click here to return to Particle Sorting Characterisation](/sub-topics/particle-sorting-characterisation)\n\n* * *\n\n[Click here to proceed to the next Activity on Gravity Separation Characterisation](/pages/wikiore-activity-5-gravity-separation)"},"image":null},"intro":{"text":""},"orderNumber":null},{"__typename":"Platform_Page","id":"65d2edb6ebf7bb9388ffb025","name":"Participants: Mining Engineering Technology Suppliers (METS)","path":"/appendices/wikiore-participants-3-a-mining-engineering-technology-suppliers-28-mets-29","slug":"wikiore-participants-3-a-mining-engineering-technology-suppliers-28-mets-29","title":null,"subtitle":null,"pretitle":null,"openGraph":{"description":{"text":"### Hatch[](#Hatch)\n\nWhatever our clients envision, our engineers can design and build. With over six decades of business and technical experience in the mining, energy, and infrastructure sectors, we know your business and understand that your challenges are changing rapidly. We respond quickly with solutions that are smarter, more efficient, and innovative. We draw upon our 9,000 staff with experience in over 150 countries to challenge the status quo and create positive change for our clients, our employees, and the communities we serve.\n\n[www.hatch.com](http://www.hatch.com)\n\n### IMDEX[](#IMDEX)\n\nREFLEX is the leader in real-time subsurface intelligence solutions for the minerals industry globally.\n\n[www.reflexnow.com/company/imdex-limited](http://www.reflexnow.com/company/imdex-limited)\n\n### JKTech[](#JKTech)\n\nJKTech delivers economic and social value to the global resources industry via high-end technology products and services in ore characterisation and process improvement within all areas of the life-of-mine cycle including geology, mining, mineral processing and sustainability. As the technology transfer company for the Sustainable Minerals Institute (SMI) at The University of Queensland, JKTech has access to leading edge technologies and methodologies.\n\n[www.jktech.com.au](http://www.jktech.com.au)\n\n### METS Ignited[](#METS_Ignited)\n\nMETS Ignited is an industry-led, government-funded, Growth Centre for the mining equipment, technology and services (METS) sector, established to enhance the competitive advantage of the Australian METS sector. It is an independent body tasked to foster collaboration, innovation and commercialisation opportunities across the mining ecosystem and to strengthen Australia’s position as a global hub for mining.\n\n[www.metsignited.org](http://www.metsignited.org)\n\n### METSO[](#METSO)\n\nMetso is an industrial company offering equipment and services for the sustainable processing and flow of natural resources in the mining, aggregates, recycling and process industries. It brings knowledge and innovative solutions to help its customers improve their operational efficiency, reduce risks and increase profitability. Metso employs over 12,000 people in more than 50 countries.\n\nwww.metso.com\n\n### Orica[](#Orica)\n\nOrica is the largest provider of commercial explosives and blasting systems to the mining and infrastructure markets, the global leader in the provision of ground support in mining and tunnelling and the leading supplier of sodium cyanide for gold extraction. Orica is focused on developing long term partnerships which reduce total cost of mining, improve productivity and enhance your licence to operate. The focus of Orica’s global R&D and Technical networks is on the technology transfer of differential blasting activities linked to Grade Engineering®.\n\n[www.orica.com](http://www.orica.com)\n\n### Sodern[](#Sodern)\n\nSodern develops cutting edge technology and has a track record of constantly bringing innovation-based solutions to the market. In the mining sector its primary technology is focused on the elemental analysis of raw materials, for quality, optimisation and profitability. Increasingly efficient technologies have been developed to analyse the composition of raw materials either on line (CNA), or downhole (FastGradeTM ), thus making it possible to optimise the mining process instantly. Through its penetration capacity, neutron based technology allows the analysis of several tonnes of material in real time.\n\n[www.sodern.com](http://www.sodern.com)"},"image":null},"intro":{"text":""},"orderNumber":null},{"__typename":"Platform_Page","id":"65d2edb6ebf7bb9388ffb006","name":"GRADE ENGINEERING PLANT","path":"/appendices/wikiore-grade-engineering-plant","slug":"wikiore-grade-engineering-plant","title":null,"subtitle":null,"pretitle":null,"openGraph":{"description":{"text":"Table of contents: \n\nDevelopment of a Grade Engineering (GE) circuit design and operating strategy requires preliminary information about ore characteristics, mine resource volume and both proportion and spatial location of GE amenable ore in the resource. A concept study on this preliminary information is conducted to provide a starting point in sizing the required equipment for GE circuit design. Any GE circuit must be evaluated as part of the mine operation value chain to examine the influence of the product on up/down stream production units performance. A trade-off study is then conducted in an iterative process between the design and economic evaluation to optimise the GE plant design that includes:\n\n* Modelling and simulation of several preliminary GE plant circuits deemed capable of upgrading marginal ROM ore.\n* For each proposed plant design\n * Provide a summary of selected equipment and operating strategies.\n * Provide incremental operating cost and major equipment cost comparisons.\n * Extraction of key economic indices such as CAPEX, OPEX, Cash Flow, IRR.\n* Narrow down the list of possible designs in conjunction with the mine plan that generates maximum value over the life of mine.\n* Optimisation of process plant design incorporating learnings from evaluations.\n\nA trade-off study aims to first, develop conventional GE circuit designs for pre-concentrating low grade ROM ore within agreed design criteria and established process parameters, and secondly minimise GE plant direct capital expenditure and operating expenditure. Battery limits for ROM ore storage and crushing stages include supply of ROM ore in mine trucks that unload into gyratory crusher and GE plant ROM bin and delivery of crushed ROM ore from primary gyratory crushing stage, via overland conveyor. This should integrate with other processing equipment capacities downstream that receive GE circuit product as feed material.\n\nMultiple crushing and screening plant configurations are assessed and compared in a trade-off study. Options examine various equipment capacities and number of required devices used in each crushing and/or associated screening stages. This is done in conjunction with the rest of the value chain as adding a stage of material treatment to the value chain influences both existing equipment operation conditions and water/energy requirements along the value chain. At this level of comparison, options considered can present with significantly different economic indices and value generated.\n\nWhen initial information for a plant design is not available engineering-based assumptions are made that incorporate any available information. These need to be confirmed in practice once a design is completed. In that case, a small GE plant configuration using mobile equipment can be installed and utilised at the operation to assess assumptions made during the economic evaluations and design study to minimise risk in the designing process. Mobile/semi mobile prefabricated equipment can include:\n\n* Combined ROM ore feed hopper and apron feeder\n* Combined feed hopper and apron feeder with sizer\n* (Semi) mobile conveyor(s)\n* Track mounted transfer conveyor which moves material from mobile conveyor to gyratory crusher product conveyors\n\nEventually, proposed GE circuit configurations are expected to provide a robust plant with suitable catch-up and surge capability to be able to cater for limited mining plan changes and adverse weather conditions. A best option is chosen based on value added and risk analysis for equipment selection and budgetary costing of the GE plant. Software modelling is used to choose and size equipment for the GE plant and define the optimum operating strategy. As well as predicting combined GE plant and gyratory crushing circuit’s stream specifications; including, stream mass and water flow rates, particle size distributions (PSDs) at the optimum LOM treatment capacity.\n\n* * *\n\n* * *\n\n[Previous Chapter: Strategic Planning with Grade Engineering](/topics/strategic-planning-with-grade-engineering) | [Next Chapter: Conducting Trials](/sub-topics/site-trials)"},"image":null},"intro":{"text":""},"orderNumber":null},{"__typename":"Platform_Page","id":"65d2edb6ebf7bb9388ffb018","name":"P1-005 Upconversion Fluoresence","path":"/appendices/wikiore-p-1-005-upconversion-fluoresence","slug":"wikiore-p-1-005-upconversion-fluoresence","title":null,"subtitle":null,"pretitle":null,"openGraph":{"description":{"text":" [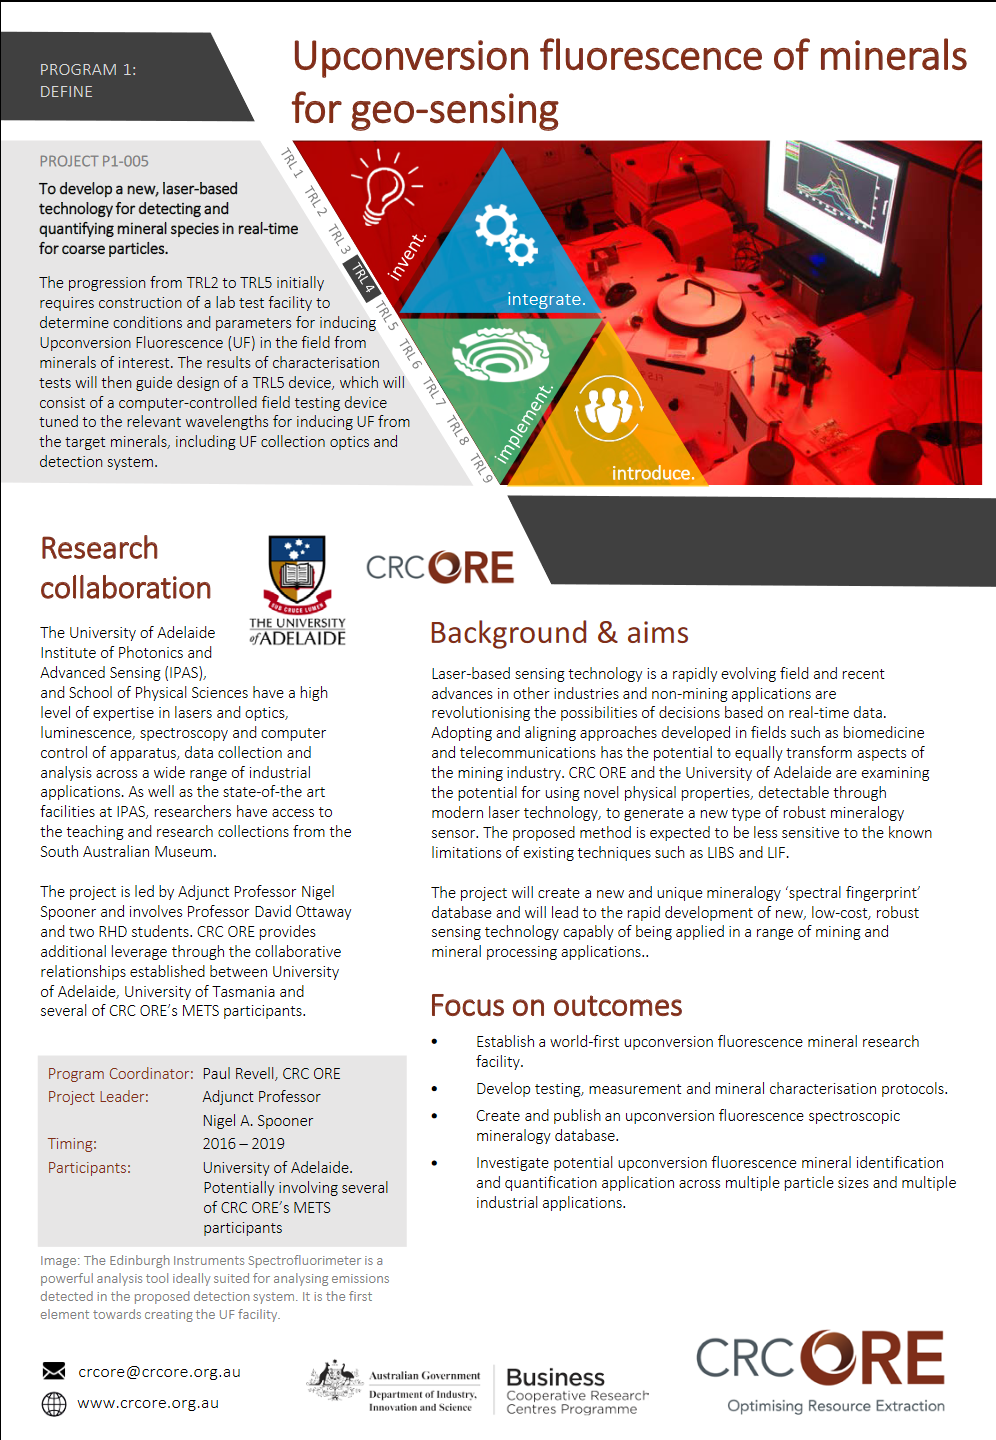](https://res.cloudinary.com/shapeable/image/upload/v1687316256/wikiore/283.png)"},"image":null},"intro":{"text":""},"orderNumber":null},{"__typename":"Platform_Page","id":"65d2edb6ebf7bb9388ffb01d","name":"P1-014 Fluorine Sensor","path":"/appendices/wikiore-p-1-014-fluorine-sensor","slug":"wikiore-p-1-014-fluorine-sensor","title":null,"subtitle":null,"pretitle":null,"openGraph":{"description":{"text":" [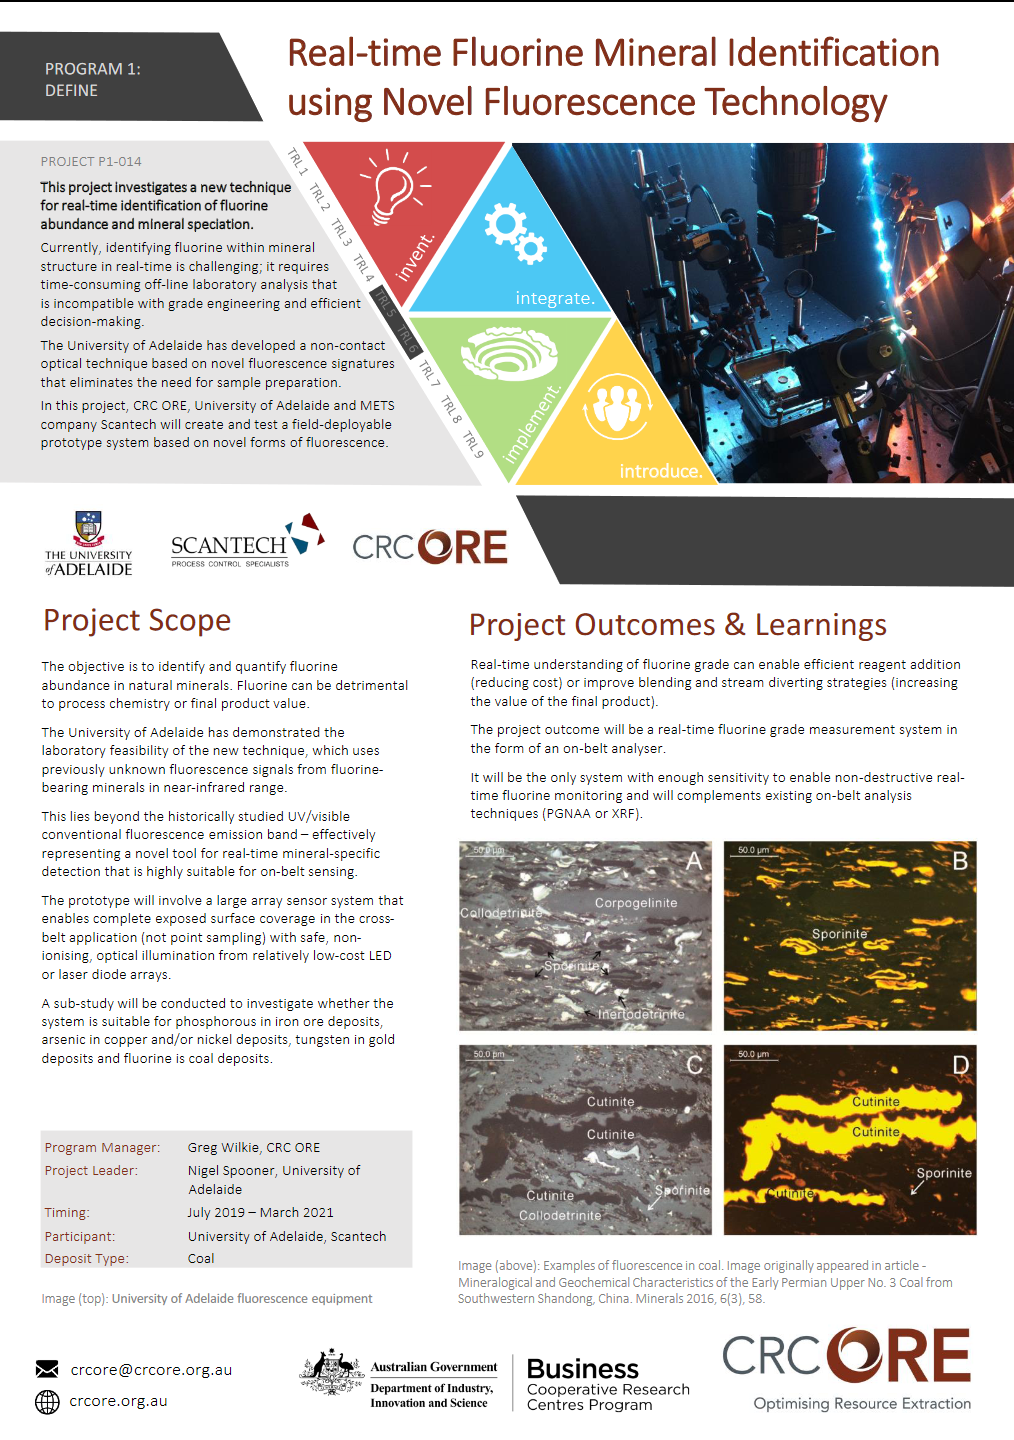](https://res.cloudinary.com/shapeable/image/upload/v1687316264/wikiore/318.png)"},"image":null},"intro":{"text":""},"orderNumber":null},{"__typename":"Platform_Page","id":"65d2edb6ebf7bb9388ffb020","name":"Participants: METS Associates","path":"/appendices/wikiore-participants-mets-associates","slug":"wikiore-participants-mets-associates","title":null,"subtitle":null,"pretitle":null,"openGraph":{"description":{"text":"* [Bear Rock Solutions](https://bear-rock.com/)\n* [Comet Strategy](https://www.cometstrategy.com/)\n* [DataMine Australia](https://www.dataminesoftware.com/)\n* [Gekko Systems](https://www.gekkos.com/)\n* [Magotteaux](https://www.magotteaux.com/)\n* [Mipac](https://www.mipac.com.au/)\n* [OreControl Blasting Consultants](https://www.ocblasting.com/about-us)\n* [Scantech](https://www.scantech.com.au/)\n* [Split Engineering](https://www.spliteng.com/)\n* [SRK Consulting Canada](https://www.srk.com/en/contact-us/canada)\n* [Whittle Consulting](https://www.whittleconsulting.com.au/)"},"image":null},"intro":{"text":""},"orderNumber":null},{"__typename":"Platform_Page","id":"65d2edb6ebf7bb9388ffb026","name":"Participants: Research Organisations","path":"/appendices/wikiore-participants-research-organisations","slug":"wikiore-participants-research-organisations","title":null,"subtitle":null,"pretitle":null,"openGraph":{"description":{"text":"### AMIRA[](#AMIRA)\n\nAMIRA International is a global member-based, non-profit, organisation headquartered in Australia but with subsidiaries in Chile, USA, and South Africa. AMIRA International is a globally networked, independent organisation, deeply experienced in facilitating the development of solutions for its members for both technical and non-technical challenges through collaboration.\n\n[www.amira.com.au](http://www.amira.com.au)\n\n### CSIRO[](#CSIRO)\n\nCSIRO is a national science agency which uses science and research to solve issues and make a difference to industry, people and the planet. Specifically to the mining sector, CSIRO collaborates on application of new technologies, resource strategies, sensor systems and automation is improving efficiency and driving productivity gains across the minerals value chain, detailed modelling systems that respond to real world data to provide real world solutions in dynamic working environments and cost effective exploration and discovery of new mineral resources is being realised through advances and expertise in detection technologies, mineral systems, resource characterisation and data analysis.\n\n[www.csiro.au](http://www.csiro.au)\n\n### Curtin University[](#Curtin_University)\n\nCurtin University is Western Australia’s largest and most culturally diverse university with Australia’s third largest international student population. Curtin is widely recognised for its practical research that is focused on solving timely, real-world problems. In recent years our research activity has grown significantly, driving our rapid rise up the international university rankings.\n\n[www.curtin.edu.au](http://www.curtin.edu.au)\n\n### Mining3[](#Mining3)\n\nMining3 is an industry-driven, global leader in mining research and innovation. We develop and deliver breakthrough innovation and technologies that transform the productivity, sustainability and safety of the mining industry. With the unique combination of trusted industry and university members that are experienced, creative and focussed, Mining3 has the clear vision to tackle industry-wide challenges. We are flexible and responsive to the changing needs of industry priorities and work to deliver real-world solutions to the mining industry.\n\n[www.mining3.com](http://www.mining3.com)\n\n### MRIWA[](#MRIWA)\n\nThe Minerals Research Institute of Western Australia is a statutory body established by the Western Australian Government under the Minerals Research Institute of Western Australia Act 2013 to stimulate minerals research to support investment in, and operation of, a globally competitive minerals industry in Western Australia.\n\n[www.mriwa.wa.gov.au](http://www.mriwa.wa.gov.au)\n\n### NRC[](#NRC)\n\nNRC Canada. NRC Energy, Mining and Environment delivers advanced technology solutions to Canada's resource and utility sectors. NRC’s unique technology risk management capabilities help companies develop and maintain a globally competitive position, and support quality improvements and cost reductions for vital products and services.\n\n[www.nrc-cnrc.gc.ca](http://www.nrc-cnrc.gc.ca)\n\n### QUT[](#QUT)\n\nQUT is a major Australian university with a global outlook and a 'real world' focus. We are transforming the student experience we offer our 50,000 students and we place a premium on the international and national accreditation of our various professional degrees. Our internationally award-winning Science and Engineering Centre is home to The Cube, acknowledged as one of the world’s largest digital interactive learning and display spaces. QUT established the world's first Creative Industries Faculty, and we invest heavily in collaborative learning and interdisciplinary research environments.\n\n[www.qut.edu.au](http://www.qut.edu.au)\n\n### University of Adelaide[](#University_of_Adelaide)\n\nThe University of Adelaide is one of Australia’s leading research-intensive universities and is consistently ranked in the top 1% of universities in the world. Established in 1874, it is Australia’s third oldest university with a strong reputation for research and teaching excellence, and graduates that make an impact on the world.\n\n[www.adelaide.edu.au](http://www.adelaide.edu.au)\n\n### The University of Queensland[](#The_University_of_Queensland)\n\nThe University of Queensland. The world class capability of mining and minerals processing research at The University of Queensland extends back over 40 years through the activities of the Julius Kruttschnitt Mineral Research Centre (JKMRC) and the WH Bryan Mining and Geology Research Centre (BRC). In 2001 these Centres were amalgamated with four others to form the Sustainable Minerals Institute and encompass all aspects of sustainable mining practice.\n\n[www.uq.edu.au](http://www.uq.edu.au)\n\n### UTAS[](#UTAS)\n\nUTAS. The ARC Centre of Excellence in Ore Deposits (CODES) is a global leader in ore deposit research and postgraduate training. Its extensive, state of the art geological laboratory facilities enable cutting edge testing across all fields of geology.\n\n[www.utas.edu.au](http://www.utas.edu.au)"},"image":null},"intro":{"text":""},"orderNumber":null},{"__typename":"Platform_Page","id":"65d2edb6ebf7bb9388ffb008","name":"Heterogeneity","path":"/appendices/wikiore-heterogeneity","slug":"wikiore-heterogeneity","title":null,"subtitle":null,"pretitle":null,"openGraph":{"description":{"text":"[](https://res.cloudinary.com/shapeable/image/upload/v1687306175/wikiore/152.jpg)\n\n‘[heterogeneity](/pages/wikiore-heterogeneity)’ as a measure of localized variability of economic drivers such as grade at mining scale. It is a term strongly promoted by CRC ORE as the important influence on [Grade Engineering](/pages/wikiore-introduction-to-grade-engineering) opportunity. \n \nVariability involves statistical measures of population distributions, whereas [heterogeneity](/pages/wikiore-heterogeneity) involves statistical measures of spatially aggregated population neighbourhoods. For mining application, population neighbourhoods are typically represented by volumes of modelled blocks at various scales of resource definition; or imposed mining volumes such as blast blocks or bench es. \n \nWhile the concept of ‘[heterogeneity](/pages/wikiore-heterogeneity)’ is widely appreciated within the CRC ORE consortium, specific definitions and methodologies suitable for routine industry application and commercial delivery are sparse. This is further complicated by ongoing uncertainty and debate around how potential measures of [heterogeneity](/pages/wikiore-heterogeneity) are best derived; and how these can be related to value drivers around coarse separation levers. This is a function of several factors :\n\n> Heterogeneity is scalar and varies dramatically as a function of neighbourhood volume – this ranges from inter-block attributes in long term resource models; to intra-bench attributes at mining scale; down to <50mm inter-particle scale attributes for ore sorting applications. \n> \n> Measures of heterogeneity are derived from analysis of existing drilling and assay data rather than specific laboratory testing. This data ranges from more widely spaced (~25-50m) resource definition related to long term planning; to closer spaced (5-10m) ore control drilling related to short term planning. \n> \n> Changes in data support directly affects resolution of heterogeneity. \n> \n> Heterogeneity is typically smoothed out in current resource definition practice and is regarded as a problem for geostatistical interpolation rather than an opportunity for exploitation. \n\nThere is often significant confusion between uncertainty and [heterogeneity](/pages/wikiore-heterogeneity) particularly involving geostatistical interpolation of more widely spaced resource drilling data. \n \n[heterogeneity](/pages/wikiore-heterogeneity) in the context of [Grade Engineering](/pages/wikiore-introduction-to-grade-engineering) drives opportunity related to [differential blasting](/pages/wikiore-induced-deportment) and bulk sensor-based separation levers. While these levers share the same intrinsic drivers, exploitation involves very different approaches related to screening for [differential blasting](/pages/wikiore-induced-deportment) and diversion for sensor-based applications. To an extent these applications are mutually competitive and require different [heterogeneity](/pages/wikiore-heterogeneity) modelling and ranking methodologies. Outcomes of bulk separation opportunity modelling are embedded into robust algorithms and software routines as add-ins to available commercial platforms.\n\nExample of Uncovering Heterogeneity:\n\n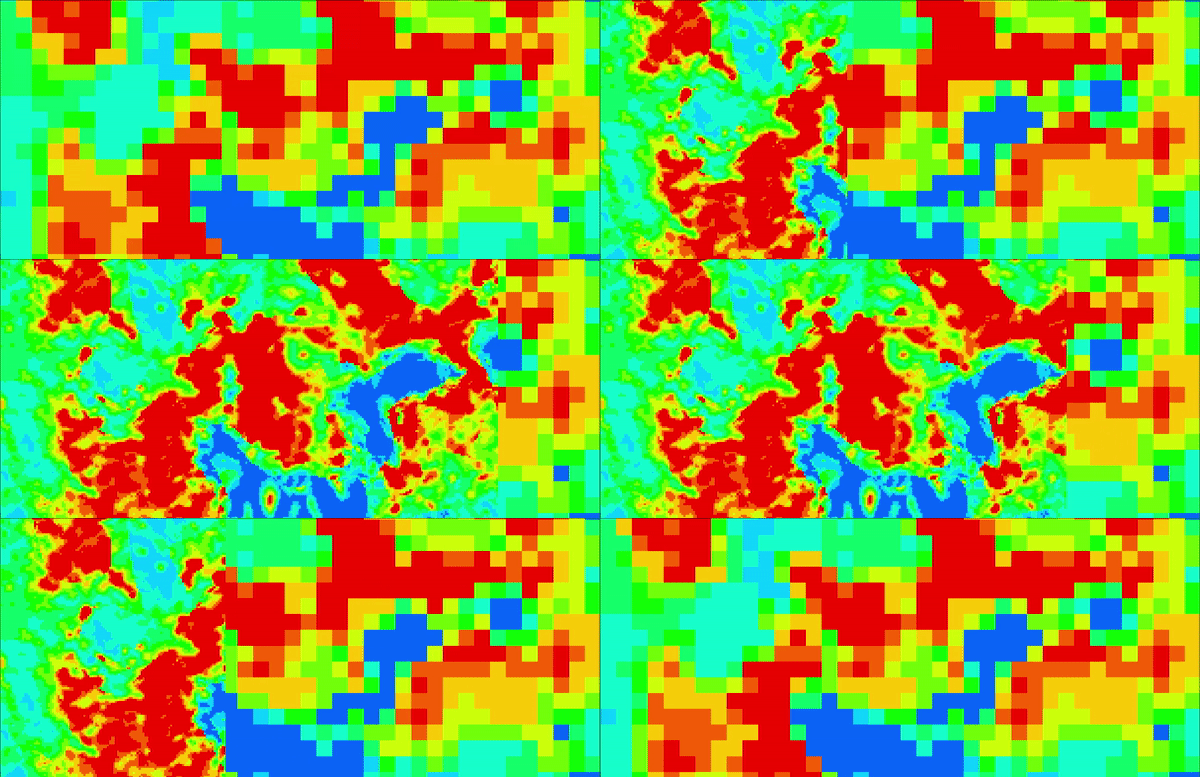 \n\n \n \n\n[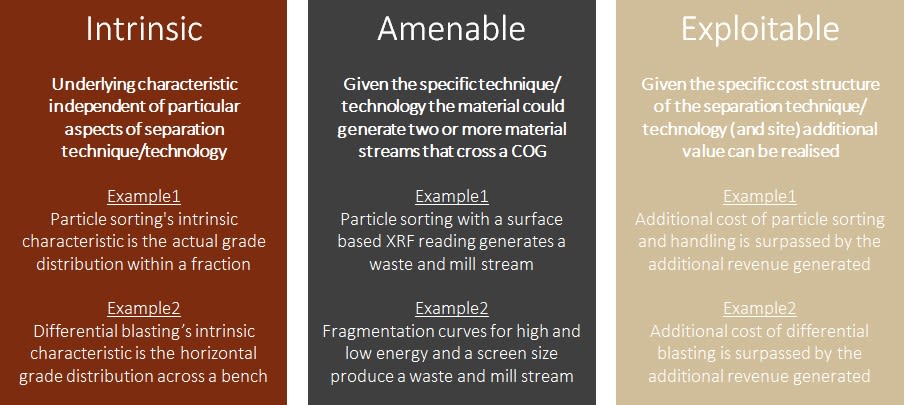](https://res.cloudinary.com/shapeable/image/upload/v1687306180/wikiore/84.jpg)\n\n \nHeterogeneity characteristics must be based on intrinsic properties of material being evaluated. By ensuring this is accurately captured any future modelling and simulation work can be confidently undertaken to determine true amenable material and eventually, in an economic evaluation, exploitable material."},"image":null},"intro":{"text":""},"orderNumber":null},{"__typename":"Platform_Page","id":"65d2edb6ebf7bb9388ffb01f","name":"P2-006 Cross-Belt Mineralogical Characterisation using LIBS","path":"/appendices/wikiore-p-2-006-cross-belt-mineralogical-characterisation-using-libs","slug":"wikiore-p-2-006-cross-belt-mineralogical-characterisation-using-libs","title":null,"subtitle":null,"pretitle":null,"openGraph":{"description":{"text":" [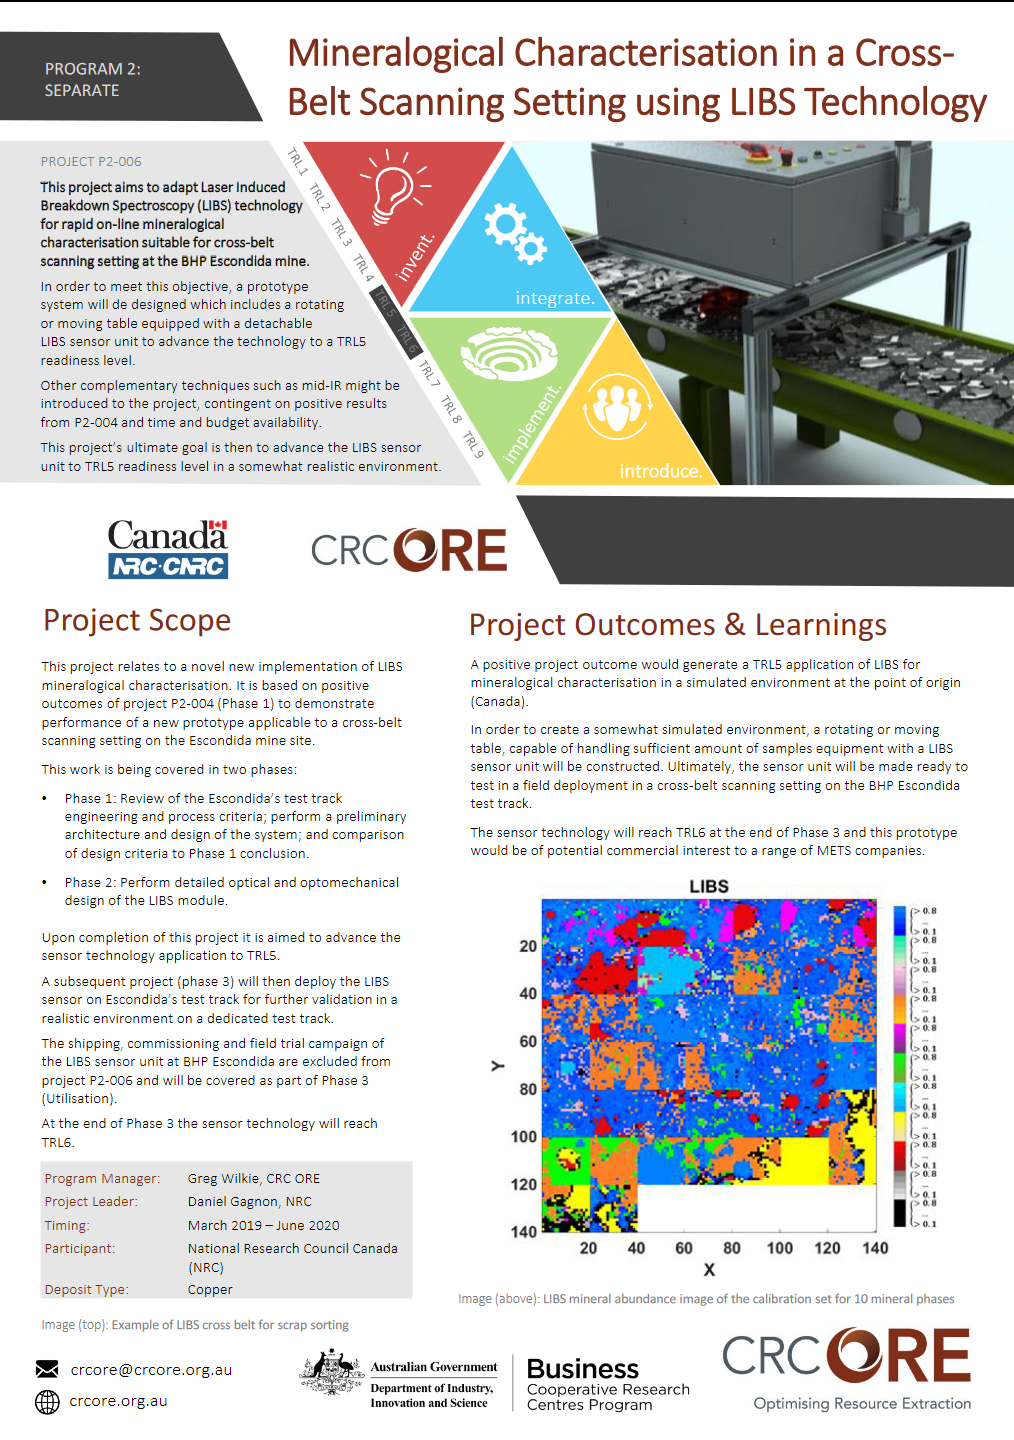](https://res.cloudinary.com/shapeable/image/upload/v1687316280/wikiore/319.png)"},"image":null},"intro":{"text":""},"orderNumber":null},{"__typename":"Platform_Page","id":"65d2edb6ebf7bb9388ffaff3","name":"Activity 1: Natural Deportment","path":"/appendices/wikiore-activity-1-natural-deportment","slug":"wikiore-activity-1-natural-deportment","title":null,"subtitle":null,"pretitle":null,"openGraph":{"description":{"text":"This activity covers the practical application of Natural Deportment characterisation concepts to lab/site based raw data to generate Response Rankings (RR) for a set of samples. Complete the supplied table to calculate a Response Ranking (RR) and Standard Deviation for each sample from the supplied assays and masses.\n\n* * *\n\n**Activity 1 Notes:**\n\n* Calculating sample grade: sum the product of all masses and grades and divide this by total mass\n* Mass and Metal Percents are calculated relative to the feed material\n * Mass% = fraction mass / feed mass\n * Metal% = (fraction grade x fraction mass) / (feed grade x feed mass)\n* Cumulative values are calculated from the finest size up\n* The Response Factor (RF) for this table is calculated from cumulative metal over cumulative mass\n* \n* Sample Response Rankings are calculated by the average\n* Standard deviations can be calculated in excel using the '=STDEV()' function\n"},"image":null},"intro":{"text":""},"orderNumber":null},{"__typename":"Platform_Page","id":"65d2edb6ebf7bb9388ffaffa","name":"Bulk Sorting","path":"/appendices/wikiore-bulk-sorting","slug":"wikiore-bulk-sorting","title":null,"subtitle":null,"pretitle":null,"openGraph":{"description":{"text":"**[Natural Deportment](/pages/wikiore-natural-deportment) | [Induced Deportment](/pages/wikiore-induced-deportment) | [Bulk Sorting](/pages/wikiore-bulk-sorting) | [Particle Sorting](/pages/wikiore-particle-sorting) | [Gravity Separation](/pages/wikiore-gravity-separation)**\n\n[bulk sorting](/pages/wikiore-bulk-sorting) involves a wide variety of sensors capable of providing on-line information on grade (or a proxy of) in the dig and deliver material handling interface. This includes [shovel](https://en.wikipedia.org/wiki/Power_shovel) buckets, [truck](https://en.wikipedia.org/wiki/Haul_truck)s and conveyors. There are many technologies capable of coarse rock sensing ranging from surface based to fully penetrative; and providing elemental to mineralogical resolution. amenability is a function of bench scale [heterogeneity](/pages/wikiore-heterogeneity); resolution and accuracy of individual sensors; and rock interaction times and signal acquisition.\n\nFor Characterisation methods for Bulk Sorting click [HERE](/sub-topics/bulk-sorting-characterisation).\n\n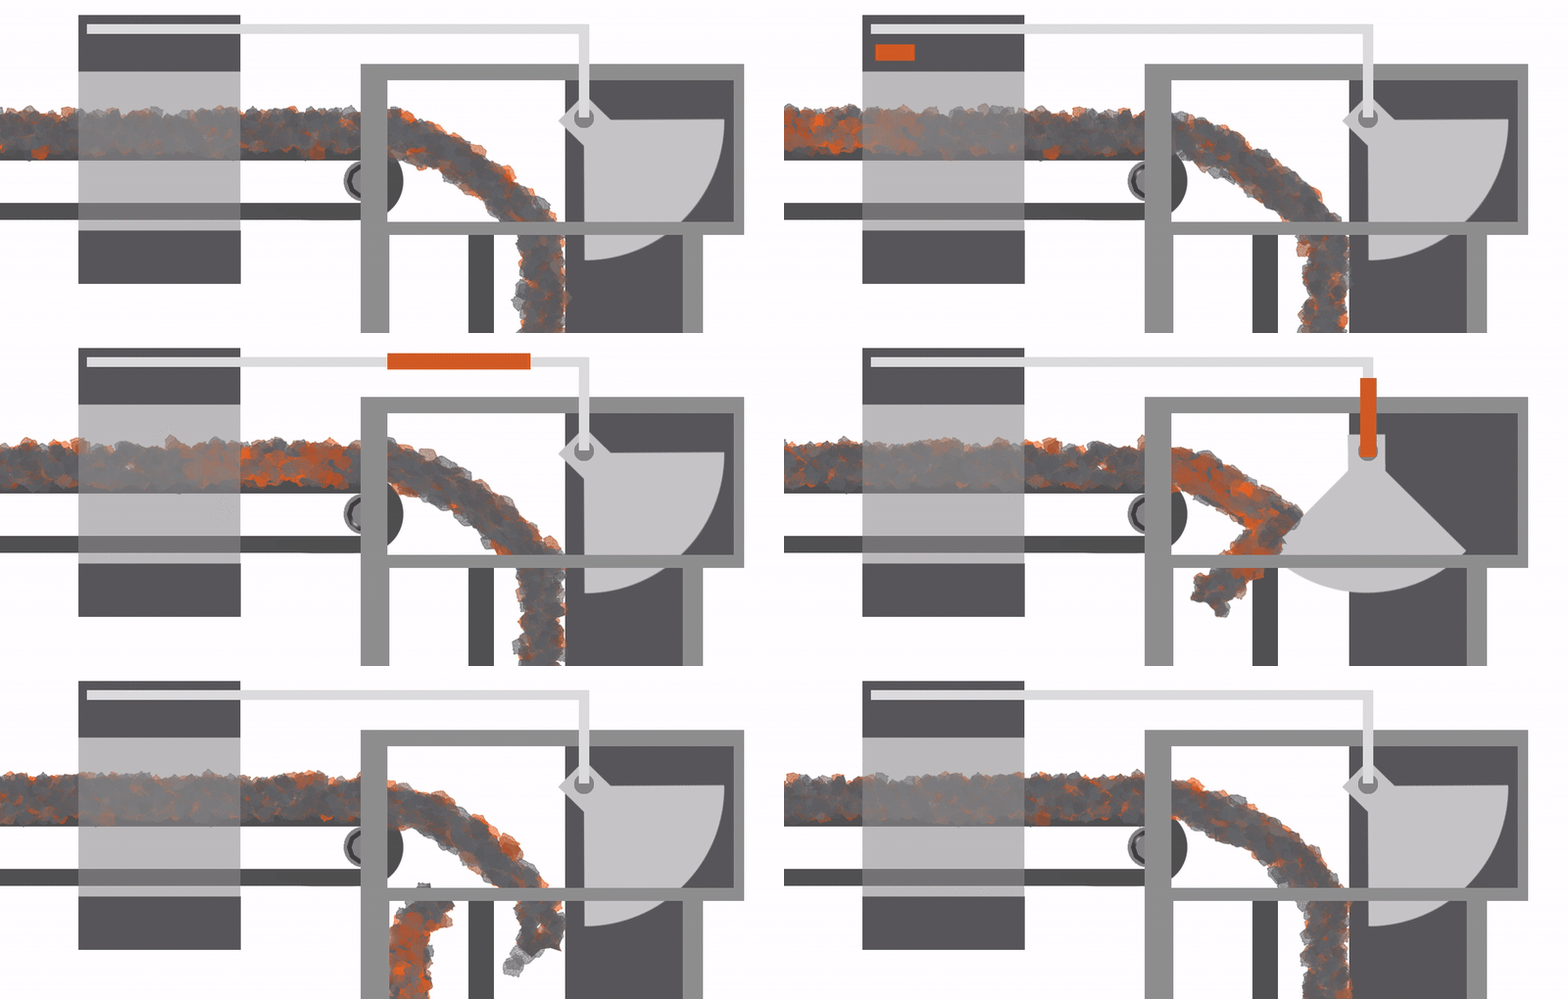 \n\nSeparation potential for [bulk sorting](/pages/wikiore-bulk-sorting) is dependant on the transfer of material from a spatial In-situ model to a temporal sequence of delivery via the dig and deliver interface.\n\n \n [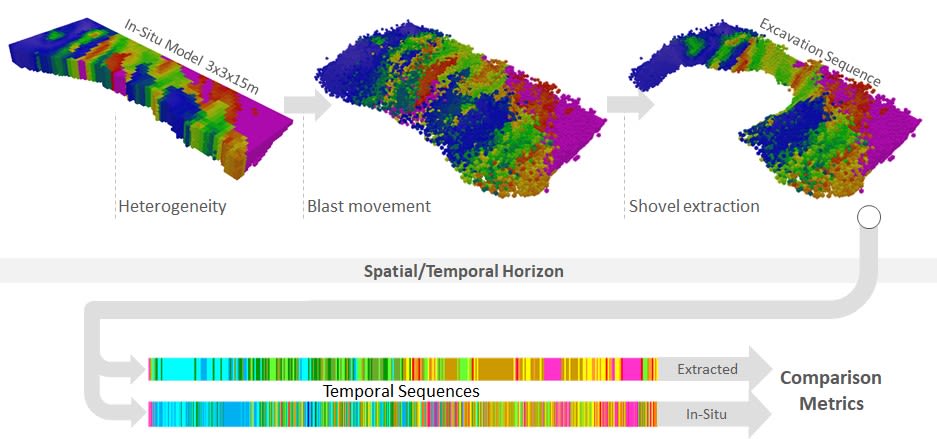](https://res.cloudinary.com/shapeable/image/upload/v1687306209/wikiore/42.jpg)"},"image":null},"intro":{"text":""},"orderNumber":null},{"__typename":"Platform_Page","id":"65d2edb6ebf7bb9388ffb003","name":"Flourine Sensors","path":"/appendices/wikiore-flourine-sensors","slug":"wikiore-flourine-sensors","title":null,"subtitle":null,"pretitle":null,"openGraph":{"description":{"text":"Table of contents:\n\n* [P1-014 Fluorine Sensor](/pages/wikiore-p-1-014-fluorine-sensor)"},"image":null},"intro":{"text":""},"orderNumber":null},{"__typename":"Platform_Page","id":"65d2edb6ebf7bb9388ffb005","name":"Gamma Activation Analysis Sensors","path":"/appendices/wikiore-gamma-activation-analysis-sensors","slug":"wikiore-gamma-activation-analysis-sensors","title":null,"subtitle":null,"pretitle":null,"openGraph":{"description":{"text":"Table of contents:\n\n* [P1-001 Gamma Activation Analysis for Geo-Sensing](/pages/wikiore-p-1-001-gamma-activation-analysis-for-geo-sensing)\n \n* [P1-009 Gold Ore Sorting Prototype](/pages/wikiore-p-1-009-gold-ore-sorting-prototype)\n \n* [P1-012 On Belt Gamma Activation Analysis Demonstration Sensing for Gold](/pages/wikiore-p-1-012-on-belt-gamma-activation-analysis-demonstration-sensing-for-gold)"},"image":null},"intro":{"text":""},"orderNumber":null},{"__typename":"Platform_Page","id":"65d2edb6ebf7bb9388ffb012","name":"Natural Deportment","path":"/appendices/wikiore-natural-deportment","slug":"wikiore-natural-deportment","title":null,"subtitle":null,"pretitle":null,"openGraph":{"description":{"text":"**[Natural Deportment](/pages/wikiore-natural-deportment) | [Induced Deportment](/pages/wikiore-induced-deportment) | [Bulk Sorting](/pages/wikiore-bulk-sorting) | [Particle Sorting](/pages/wikiore-particle-sorting) | [Gravity Separation](/pages/wikiore-gravity-separation)**\n\n \n\n\n\n[natural deportment](/pages/wikiore-natural-deportment) is the propensity for some ores to exhibit [preferential breakage](/pages/wikiore-natural-deportment) leading to concentration of minerals into specific size fraction s. This typically involves an increase of valuable mineral phases in finer size fractions, however has occassionally been observed in the coarser fraction under certain geological settings. The geology and mineral association of base and precious metal deposits is typically complex with many overprinting paragenetic events contributing to the creation of potentially mineable reserves.This is evident in features such as multiple [vein](https://en.wikipedia.org/wiki/Vein_%28geology%29) events; different mineral associations and intergrowths; varying alteration styles and mineralogy’s; metamorphic overprints; banding; discrete lenses and replacement textures.\n\n> “This occurs when crack branching occurs more frequently in one of the mineral phases.\n> \n> \n> The most obvious manifestation of [preferential breakage](/pages/wikiore-natural-deportment) is a variation of average composition with [particle size](https://en.wikipedia.org/wiki/Particle_size) in the particle populations. This is often noticed in practice and is easy to detect and measure.”\n> \n> _R. P. King - Modelling and Simulation of Mineral Processing Systems 2001_\n\nNatural Deportment is an interaction function of these rock mass properties, texture, ore paragenesis and mineralogy at a range of scales. There is typically no relationship between magnitude of response and head grade, with the main control being textural rather than absolute abundance. Physical separation is a function of screening employed after blasting or primary crushing. Testing involves screening or sieving of a particle size distribution resulting from sampling production scale blasting (+/-primary crushing) material, or from crushing drillcore using a defined protocol. Sampling and testing protocols are generally readily capable of being completed by most onsite laboratories, or any commercial laboratory of a sites preference.\n\n \nFor Characterisation methods for Natural Deportment click [HERE](/sub-topics/natural-deportment-characterisation)."},"image":null},"intro":{"text":""},"orderNumber":null},{"__typename":"Platform_Page","id":"65d2edb6ebf7bb9388ffb021","name":"Participants: METS Associates","path":"/appendices/wikiore-participants-3-a-mets-associates","slug":"wikiore-participants-3-a-mets-associates","title":null,"subtitle":null,"pretitle":null,"openGraph":{"description":{"text":"* [Bear Rock Solutions](https://bear-rock.com/)\n* [Comet Strategy](https://www.cometstrategy.com/)\n* [DataMine Australia](https://www.dataminesoftware.com/)\n* [Gekko Systems](https://www.gekkos.com/)\n* [Magotteaux](https://www.magotteaux.com/)\n* [Mipac](https://www.mipac.com.au/)\n* [OreControl Blasting Consultants](https://www.ocblasting.com/about-us)\n* [Scantech](https://www.scantech.com.au/)\n* [Split Engineering](https://www.spliteng.com/)\n* [SRK Consulting Canada](https://www.srk.com/en/contact-us/canada)\n* [Whittle Consulting](https://www.whittleconsulting.com.au/)"},"image":null},"intro":{"text":""},"orderNumber":null},{"__typename":"Platform_Page","id":"65d2edb6ebf7bb9388ffb017","name":"P1-001 Gamma Activation Analysis for Geo-Sensing","path":"/appendices/wikiore-p-1-001-gamma-activation-analysis-for-geo-sensing","slug":"wikiore-p-1-001-gamma-activation-analysis-for-geo-sensing","title":null,"subtitle":null,"pretitle":null,"openGraph":{"description":{"text":" [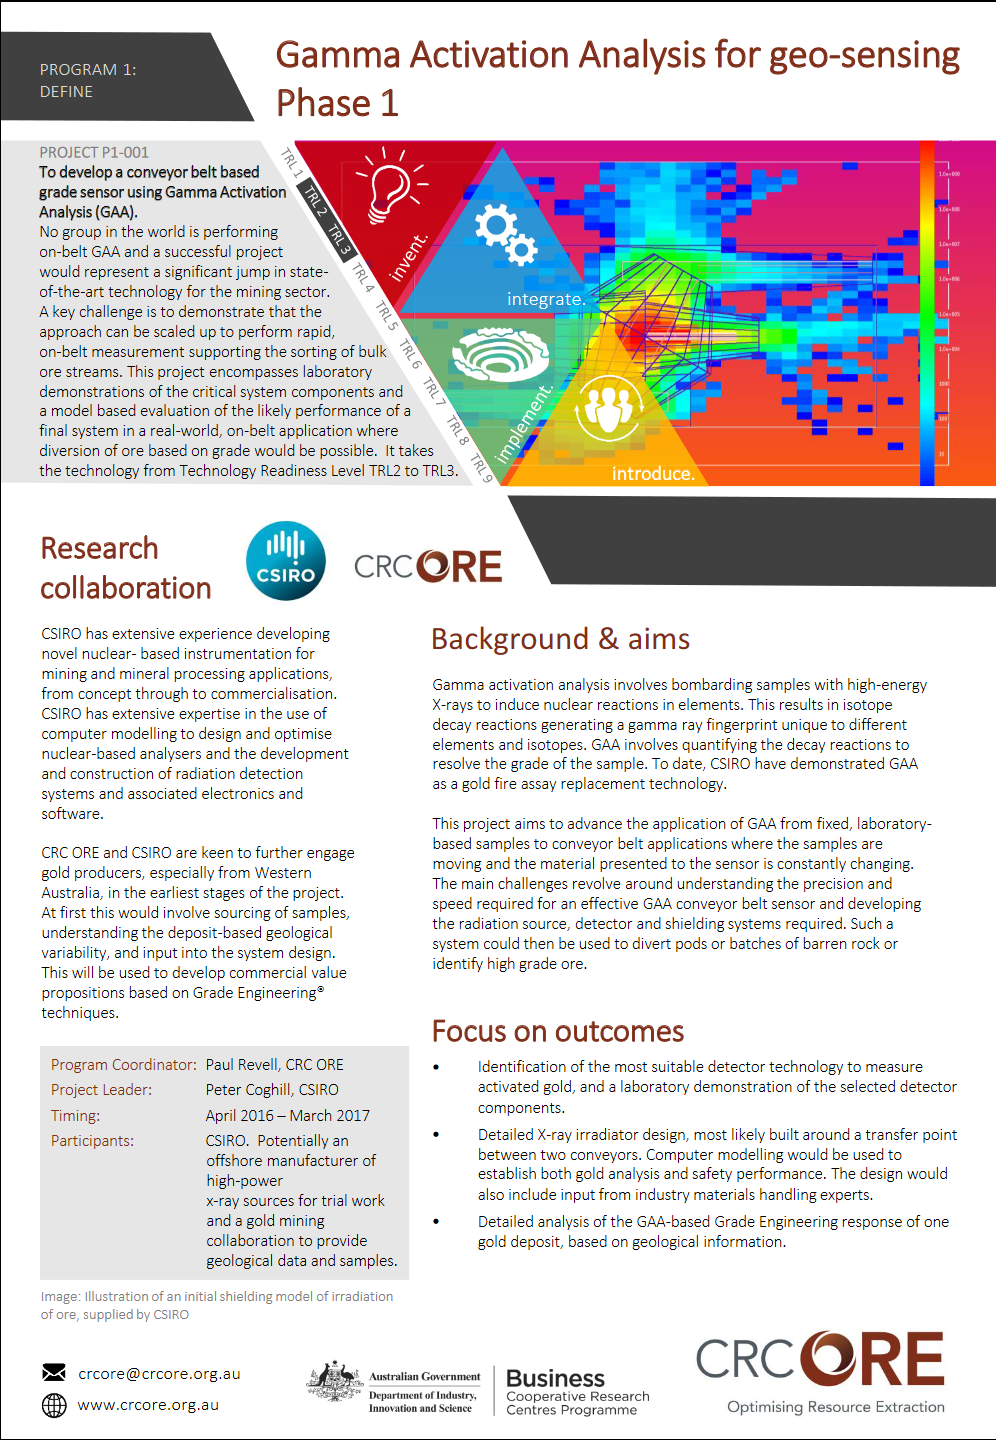](https://res.cloudinary.com/shapeable/image/upload/v1687316266/wikiore/285.png)"},"image":null},"intro":{"text":""},"orderNumber":null},{"__typename":"Platform_Page","id":"65d2edb6ebf7bb9388ffb019","name":"P1-006 Geological Controls on Grade by Size","path":"/appendices/wikiore-p-1-006-geological-controls-on-grade-by-size","slug":"wikiore-p-1-006-geological-controls-on-grade-by-size","title":null,"subtitle":null,"pretitle":null,"openGraph":{"description":{"text":" [](https://res.cloudinary.com/shapeable/image/upload/v1687316075/wikiore/281.png)"},"image":null},"intro":{"text":""},"orderNumber":null},{"__typename":"Platform_Page","id":"65d2edb6ebf7bb9388ffb02e","name":"Site Trials in Action","path":"/appendices/site-trials-in-action","slug":"site-trials-in-action","title":null,"subtitle":null,"pretitle":null,"openGraph":{"description":{"text":"Bulk Sorting Plants[](#Bulk_Sorting_Plants)\n===========================================\n\nTo learn more about different sensor types click [HERE](/pages/wikiore-stream-heterogeneity).\n\nScreening Plants[](#Screening_Plants)\n====================================="},"image":null},"intro":{"text":""},"orderNumber":null},{"__typename":"Platform_Page","id":"65d2edb6ebf7bb9388ffb02c","name":"Sampling","path":"/appendices/wikiore-22-sampling","slug":"wikiore-22-sampling","title":null,"subtitle":null,"pretitle":null,"openGraph":{"description":{"text":"Depending on the level of study being undertaken sampling design and requirements range from straightforward to more complex full [geomet](https://en.wikipedia.org/wiki/Geometallurgy)allurgical style programs. [opportunity assessment](/sub-topics/opportunity-assessments)s utilise current site domains as a basis for generating a simple testing matrix. This then generates a first order result which is used to refine a second phase of testing. If separation potential is found, subsequent characterisation steps are designed to increase confidence and understanding of key response drivers. Alternatively, if no separation is found, then subsequent testing campaigns refocus efforts onto other options more likely to impact a given site.\n\nThe purpose of the [grade by size](/pages/wikiore-natural-deportment) testing is to define if specific [assay](https://en.wikipedia.org/wiki/Assay) elements (as a proxy for mineralogy) are preferentially deporting into specific size fraction s. This typically involves a systematic increase in finer fractions. [assay](https://en.wikipedia.org/wiki/Assay)s from a series of size fractions for each sample are used to generate **Response Curves**. A mathematical function is fitted to individual curves to generate a **[Response Ranking](/sub-topics/natural-deportment-characterisation) (RR)** \\- a single number used to describe the magnitude of a Response Curve. [Response Ranking](/sub-topics/natural-deportment-characterisation)s are used as inputs into [Grade Engineering](/pages/wikiore-introduction-to-grade-engineering) process simulation. Testing can be carried out at drill core, blast hole chip or RC - though both these methods tend to provide less robust data most probably due to the impact or percussion impact nature of the breakage - or mill feed production scale although there are obviously transforms required to compare different scales.\n\n [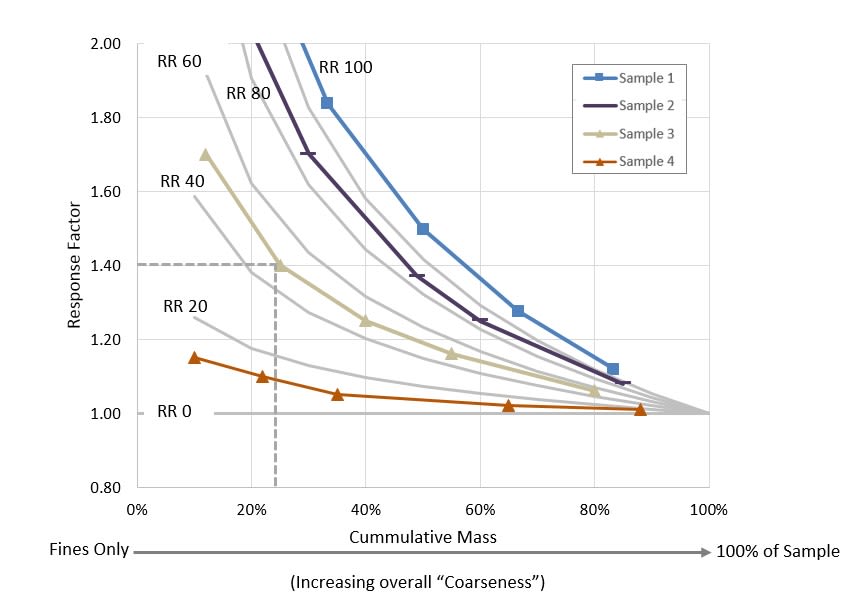](https://res.cloudinary.com/shapeable/image/upload/v1687255674/wikiore/186.jpg) \n\nDrill Core Sampling[](#Drill_Core_Sampling)\n===========================================\n\n[grade by size](/pages/wikiore-natural-deportment) testing can be carried out using coarse residues generated by [crushing](https://en.wikipedia.org/wiki/Crusher) during routine laboratory [assay](https://en.wikipedia.org/wiki/Assay) preparation as a precursor to pulverisation. Many projects/sites routinely store coarse residues specifically for future testing or check [assay](https://en.wikipedia.org/wiki/Assay)ing. In this case stored coarse residues can be used for cost effective [grade by size](/pages/wikiore-natural-deportment) testing. Stored pulps are not suitable for [grade by size](/pages/wikiore-natural-deportment) testing as the material is too fine.\n\n \nIntrinsic rock characteristics can be measured using a range of tools available (e.g. core scanning devices, visual logging etc…) pre breakage and then linked to subsequent separation characteristics to aid in model development.\n\n \nSpecific samples should be selected to ensure coverage of both relevant domains and production years. As a guide to commence a study, each domain as defined by the resource model is a good statrting point. Ideally each domain should have at least 10 samples included in the first round of testing.\n\nIn many cases drill core testing is the only method to evaluate future ores/domains in the mine plan, unless they are exposed in the current mine workings.\n\n[crushing](https://en.wikipedia.org/wiki/Crusher) Protocols[](#crushing_Protocols)\n----------------------------------------------------------------------------------\n\n[crushing](https://en.wikipedia.org/wiki/Crusher) protocols for coarse residues vary between sites and companies. The protocol is capable of being replicated in almost any onsite lab, and all commercial laboratories. It requires no special or unique methodology or equipment.\n\nThe prime purpose of coarse residues is to reduce the size of a drill core sample to a [particle size](https://en.wikipedia.org/wiki/Particle_size) distribution that is statistically suitable for splitting off a fraction which can be used for fine pulverising prior to chemical [assay](https://en.wikipedia.org/wiki/Assay)ing. A typical top size for coarse residues is 99% passing -3.35mm or the equivalent #6 mesh. This is sometimes expressed as 80% passing 2mm.However, very little quality control on the [particle size](https://en.wikipedia.org/wiki/Particle_size) distribution of coarse residues is generally carried out. [particle size](https://en.wikipedia.org/wiki/Particle_size) distributions are a function of the crusher gap setting, size of the initial drill core and hardness of the rock. Crusher gap settings in particular can vary between laboratories or drift over time.Within limits this variability does not affect use of coarse residues for [grade by size](/pages/wikiore-natural-deportment) testing. However, it is necessary to establish actual [particle size](https://en.wikipedia.org/wiki/Particle_size) distributions for site specific coarse residues as part of an initial evaluation program in order to select optimal sieve sizes for routine testing. Mass of specific sieve size fractions is also monitored during routine testing before samples are sent off for [grade by size](/pages/wikiore-natural-deportment) [assay](https://en.wikipedia.org/wiki/Assay)ing to provide a qa/qc flag for samples that show unusual mass distribution that may not be suitable for grade by size testing.The key overriding decision point on sieve size selection is generation of the minimum number of data points to define a statistically meaningful Response Curve and Ranking. This requires a minimum of three sieve sizes (generating four size fractions) that cover the cumulative mass range as shown. \n \nFor an initial orientation program it is recommended that 5 sieves are used generating six size fractions. An example is shown below.\n\n [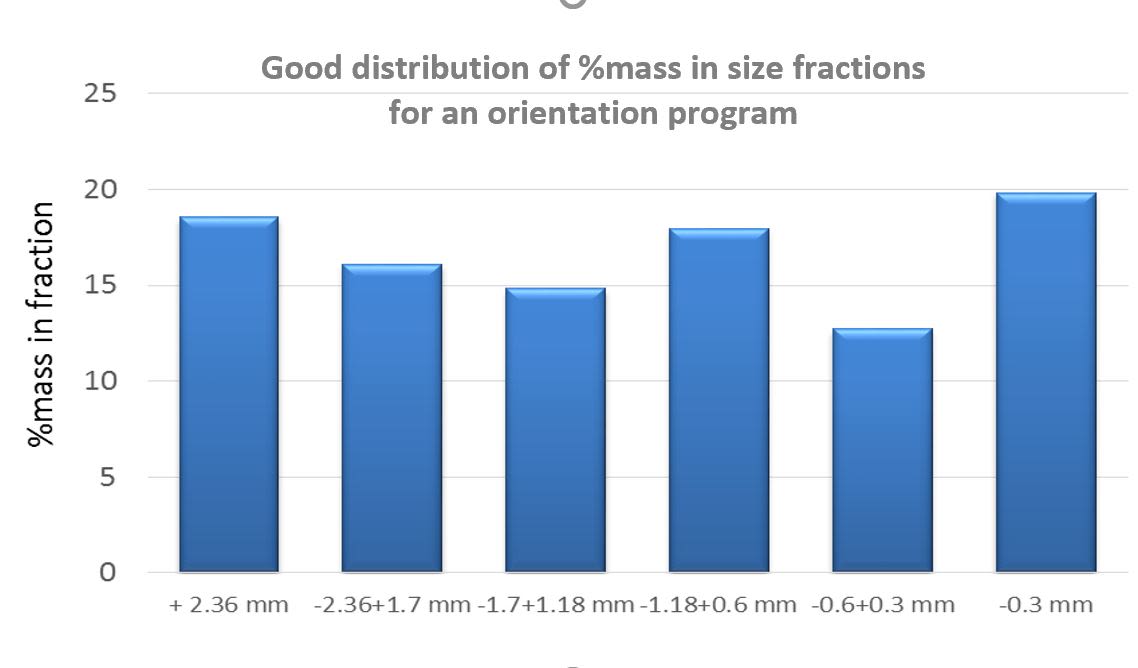](https://res.cloudinary.com/shapeable/image/upload/v1687255675/wikiore/189.jpg)\n\nBulk Sampling Options[](#Bulk_Sampling_Options)\n===============================================\n\nIn Pit or Stockpile Meso Sample[](#In_Pit_or_Stockpile_Meso_Sample)\n-------------------------------------------------------------------\n\nThis method can be used as a guide to determine the \"real world\" response of the RR from run of mine ore. Note the sample is NOT fully representative of the rock mass to be sampled, and will contain a bias that is unquantified at this stage.\n\nThe actual method to be deployed will vary to the equipment and resources available, but may follow the below as a guide. It is reccommended to sample minimum of 500-600kg with small [loader](https://en.wikipedia.org/wiki/Loader_%28equipment%29), escavator or bobcat (or 2 x 44 gallon drum equivalent) and upto 4-5 tonnes at the maximum.\n\nSample WILL be biased as the method will likely avoid rocks >200-300mm. However it is relatively easy to collect and process and will provide initial guide to [natural deportment](/pages/wikiore-natural-deportment) response. Second stage representative bulk sampling can be completed later, if initial test work warrants follow up\n\nLaboratory Screening[](#Laboratory_Screening)\n=============================================\n\n**Meso Sample**[](#Meso_Sample)\n-------------------------------\n\nAt either the onsite lab, or a commercial lab the sample needs to undergo preparation for screening, weighing and [assay](https://en.wikipedia.org/wiki/Assay). The method will vary from location to location. As a guide the below method has been utilised several times, with the ability to process approximately 100 meso samples in 2 weeks on site.\n\n* Transport sample to onsite/offsite lab\n* Dump sample onto a large tarp for contamination purposes, and ease of retaining the fines\n* Several technicians manually screen entire pile manually with sequentially reduced sized Gilson screens\n* Finer fractions screened with RoTap in the lab\n* Initial screen sizes need to be assessed but the sites prior knowledge of blasting [particle size](https://en.wikipedia.org/wiki/Particle_size) distribution should assist. Otherwise a common starting point may be: +110mm, -110+60mm, -60+30mm and -30mm\n* Weigh each fraction when entire sample has been processed\n* Crush and split for [assay](https://en.wikipedia.org/wiki/Assay) (all material) each fraction for [assay](https://en.wikipedia.org/wiki/Assay)\n* Multiple spliiting and reduction stages maybe required depending on starting mass\n* [assay](https://en.wikipedia.org/wiki/Assay)ing method, [assay](https://en.wikipedia.org/wiki/Assay) suite and repeats/duplicates etc should be determined by sites current knowledge, requirements and methods\n* It may be important to [assay](https://en.wikipedia.org/wiki/Assay) not only for target elements, but delaterious elements in case they are also upgraded (or downgraded) by [metal deportment](/pages/wikiore-natural-deportment)\n\n**Bulk Sample - Manual Preparation**\\_\\_[](#Bulk_Sample_-_title_Create_page:_Manual_Preparation_class_wiki_wikinew_text-danger_tips_Manual_Preparation__)\n---------------------------------------------------------------------------------------------------------------------------------------------------------\n\nPreparation for a bulk sample is essentially the same for meso samples, but the starting sample is larger and is more represenataive of the entire PSD.\n\n* Collect 3 to 4 tonne of run of mine sample collected by [excavator](https://en.wikipedia.org/wiki/Excavator) or [loader](https://en.wikipedia.org/wiki/Loader_%28equipment%29) - expit or stockpile\n* Dump sample onto a large tarp for contamination purposes, and ease of retaining the fines\n* Several technicians manually screen entire pile manually with sequentially reduced sized Gilson screens\n* Finer fractions screened with RoTap in the lab\n* Initial screen sizes need to be assessed but the sites prior knowledge of blasting [particle size](https://en.wikipedia.org/wiki/Particle_size) distribution should assist. Otherwise a common starting point may be: +110mm, -110+60mm, -60+30mm and -30mm\n* Weigh each fraction when entire sample has been processed\n* Crush and split for [assay](https://en.wikipedia.org/wiki/Assay) (all material) each fraction for [assay](https://en.wikipedia.org/wiki/Assay)\n* Multiple spliiting and reduction stages maybe required depending on starting mass\n* [assay](https://en.wikipedia.org/wiki/Assay)ing method, [assay](https://en.wikipedia.org/wiki/Assay) suite and repeats/duplicates etc should be determined by sites current knowledge, requirements and methods\n* It may be important to [assay](https://en.wikipedia.org/wiki/Assay) not only for target elements, but delaterious elements in case they are also upgraded (or downgraded) by [metal deportment](/pages/wikiore-natural-deportment)\n\nCommercial Gilson Screen (or equivalent)[](#Commercial_Gilson_Screen_or_equivalent_)\n------------------------------------------------------------------------------------\n\nThis sample preparation is effectively the same as a meso sample however with some modifications. They key difference is the use of a large Gilson Screen (or equivalent) to remove the manual labour. Size is generally limited to several 100's kilograms.\n\n* Top screen size is generally 100mm. Visually remove oversize manually\n* Sequentially fed balance through Gilson in smalerl batches\n* Trays emptied and material stockpiled as required\n* Repeat until entire sample processedInitial screen sizes need to be assessed but sites knowledge, but approximately +110mm, 110 - 60mm, 60 - 30mm and -30mm\n* Weigh each fraction\n* Crush and split for [assay](https://en.wikipedia.org/wiki/Assay) (all material) each fraction for [assay](https://en.wikipedia.org/wiki/Assay)\n* Multiple spliting and reduction stages maybe required depending on starting mass\n* [assay](https://en.wikipedia.org/wiki/Assay)ing method, [assay](https://en.wikipedia.org/wiki/Assay) suite and repeats/duplicates etc should be determined by sites current knowledge, requirements and methods\n* It may be important to [assay](https://en.wikipedia.org/wiki/Assay) not only for target elements, but delaterious elements in case they are also upgraded (or downgraded) by [metal deportment](/pages/wikiore-natural-deportment)\n\n \nNote: This process is readily available in commercial laboratories. It is reccommended to closely supervise all sample preparation methods as the preparation is labourious. CRC ORE has found \"short cutting\" has been an issue on several occassions where supervision is lacking.\n\n**[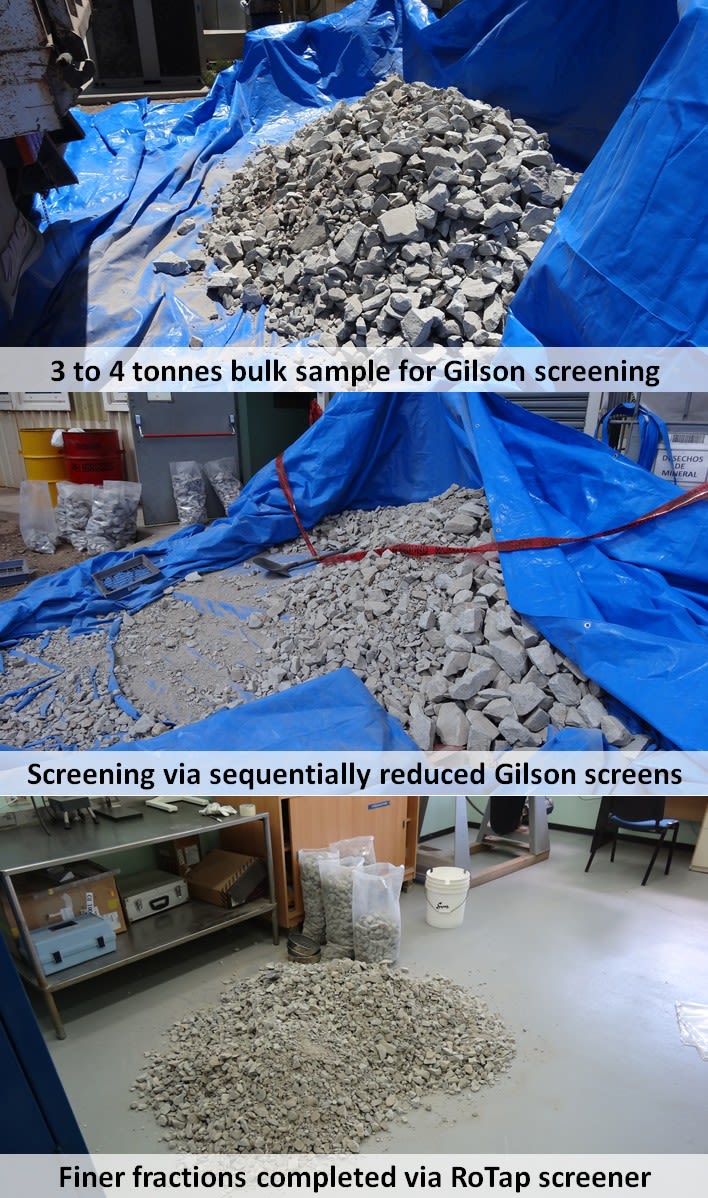](https://res.cloudinary.com/shapeable/image/upload/v1687255677/wikiore/103.jpg)**\n\n**Bulk Sample - Custom Jig**[](#Bulk_Sample_-_Custom_Jig)\n=========================================================\n\n \nCRC ORE has built and supervised a custom screening [JIG](https://en.wikipedia.org/wiki/Jig_concentrators) that has proven to be effective and efficient. All parts are generally available on most mine sites. It is particlarly effective when utilised for screening the [sub-sample](https://en.wikipedia.org/wiki/Sub-sampling_%28chemistry%29)s collected by either [loader](https://en.wikipedia.org/wiki/Loader_%28equipment%29)s or [excavator](https://en.wikipedia.org/wiki/Excavator)s from a mobile [jaw crusher](https://en.wikipedia.org/wiki/Crusher#Jaw_crusher) as discussed below.\n\n* Collect appropriate sized [sub-sample](https://en.wikipedia.org/wiki/Sub-sampling_%28chemistry%29)s in free fall from a mobile crusher\n* Collected by either [excavator](https://en.wikipedia.org/wiki/Excavator) (preferred - less sample bias) or [loader](https://en.wikipedia.org/wiki/Loader_%28equipment%29) (potential sample bias)\n* Standard screens maybe sourced from a screening deck that are commonly used on site for roadbase and/or stemming\n* A topsize screen maybe welded up from re-bar if standard screens are not available\n* Requires appropriate sized collection box for final fines at the bottom - or a heavy duty tarp for subsequent collection\n* Spacers are required for each screen\n* Material fed in 50-100kg batches onto screen jig\n* Manually shake/roll screens\n* As screens fill transfer topsize material directly into a storage container, and smaller \"middling\" fractions into double bagged sample bags\n* [shovel](https://en.wikipedia.org/wiki/Power_shovel) finest fraction into bags and clean up with dustpan & brush to ensure all material is collected\n* Weighing, [crushing](https://en.wikipedia.org/wiki/Crusher) and [assay](https://en.wikipedia.org/wiki/Assay) is as per above methods\n\n **[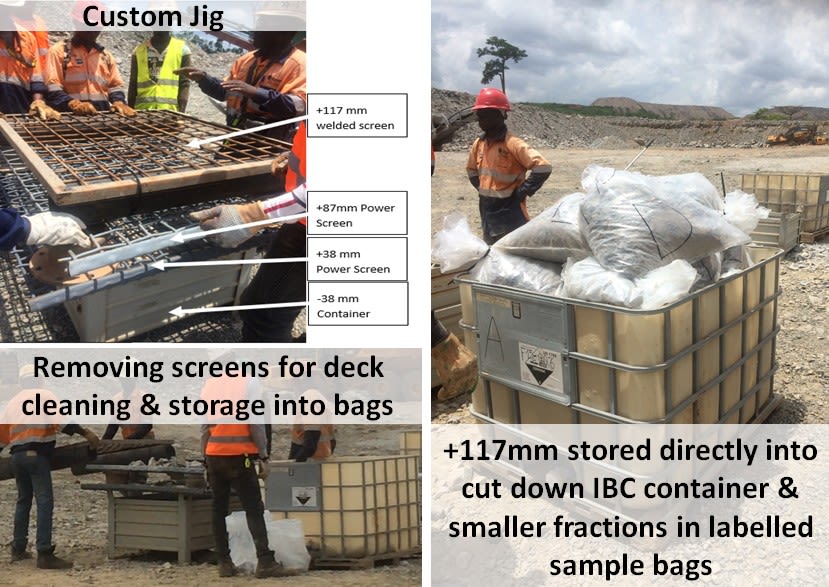](https://res.cloudinary.com/shapeable/image/upload/v1687255679/wikiore/104.jpg)**\n\n**Manual Belt Cuts**[](#Manual_Belt_Cuts)\n=========================================\n\n [meso scale](/sub-topics/sampling) [belt cut](/sub-topics/sampling)s can also be obtained from [production conveyor](https://en.wikipedia.org/wiki/Conveyor_belt)s. [meta data](https://en.wikipedia.org/wiki/Metadata) relevant to the sample should try and be captured where possible, such as the source dig block, [truck](https://en.wikipedia.org/wiki/Haul_truck) number or [shovel](https://en.wikipedia.org/wiki/Power_shovel). This allows sample characterisation to be matched to ore types or domains.\n\nConsideratyions that need to be taken into account are;\n\n1. Sample [meta data](https://en.wikipedia.org/wiki/Metadata) - eg: Are samples from 1 source ([truck](https://en.wikipedia.org/wiki/Haul_truck)s or [shovel](https://en.wikipedia.org/wiki/Power_shovel)) or blended sources. Single sources are preferable.\n\n[primary crusher](https://en.wikipedia.org/wiki/Crusher) – Normal operating mode should be maintained and close size setting confirmed\n\n1. Sampling at the conveyor after primary [crushing](https://en.wikipedia.org/wiki/Crusher)\n2. If in a [crushing](https://en.wikipedia.org/wiki/Crusher) line/system a [grizzly](https://en.wikipedia.org/wiki/Trommel_screen#Grizzly_screen) screen is present before the crusher, the following considerations need to be considered before sampling:\n 1. Sample [truck](https://en.wikipedia.org/wiki/Haul_truck) should try to skip the [grizzly](https://en.wikipedia.org/wiki/Trommel_screen#Grizzly_screen) screen, and try to dump straight into the crusher. Only if operational and safety protocols permit.\n 2. If Grissly screen can not be skipped, sampling can go ahead with screen in place only if Grissley screen is not scalping or separating more than 2% of the total material. If the Grissly scalps less than 2% then the material not sampled is minimal and should not effect preliminary studies.\n 3. If Grissly screen scalps more than 2% of the material, then that specific [crushing](https://en.wikipedia.org/wiki/Crusher) line can not be utilized for sampling, or consideration needs to be given to rock breaking the oversize for sampling purposes. The need to sample the oversize is less critical for ortientation studies, but becomes increasingly relevant for operational deployment studies.\n\n **[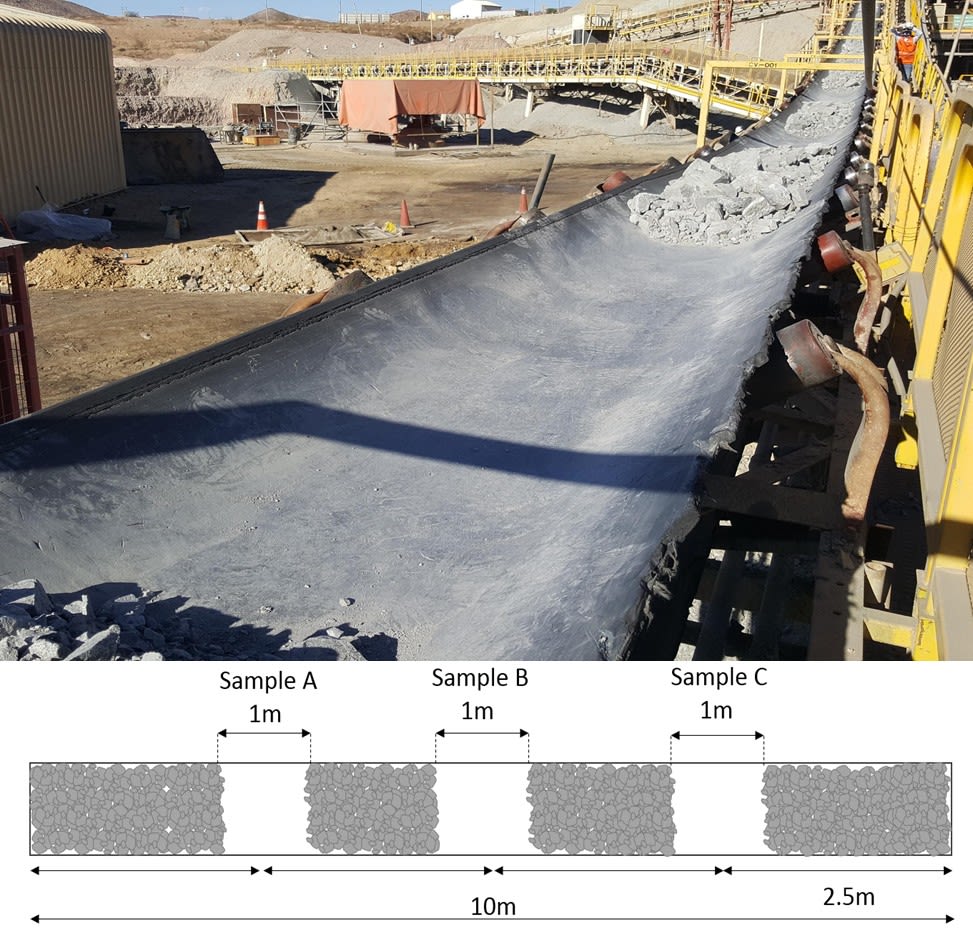](https://res.cloudinary.com/shapeable/image/upload/v1687255681/wikiore/105.jpg)**\n\nIdentify the following [meta data](https://en.wikipedia.org/wiki/Metadata) details before dumping at the [primary crusher](https://en.wikipedia.org/wiki/Crusher) for testing: \n - What region and polygon is the [truck](https://en.wikipedia.org/wiki/Haul_truck) load coming from. \n - Expected tonnage of [truck](https://en.wikipedia.org/wiki/Haul_truck) \n - Expected rock type \n - Expected average grades for elements of interest. \n - [truck](https://en.wikipedia.org/wiki/Haul_truck) ID, time of dumping, and final destination of material.\n\nIf practical ensure conveyor belt has no material from other [truck](https://en.wikipedia.org/wiki/Haul_truck) load before sample [truck](https://en.wikipedia.org/wiki/Haul_truck) dumps on [primary crusher](https://en.wikipedia.org/wiki/Crusher), or feed 3-4 [truck](https://en.wikipedia.org/wiki/Haul_truck)s of same material to \"flush\" the system. \nOnce sample [truck](https://en.wikipedia.org/wiki/Haul_truck) load dumps on [primary crusher](https://en.wikipedia.org/wiki/Crusher) and material is visible on at least 10 meters of conveyor belt, stop conveyor belt. Isollation and sampling practices should be developed and followed according to sites requirements. \nTake upto 3 samples as in the figure (e.g. Sample A, Sample B, Sample C) from conveyor belt, with a spacing of at least 1.5m between samples. Sample mass should be calculated from sampling theory according to [particle size](https://en.wikipedia.org/wiki/Particle_size)s, metal distribution and sampling constants if known.\n\nAfter samples have been taken, the rest of the [truck](https://en.wikipedia.org/wiki/Haul_truck) load passing through the crusher can continue to its original destination without further interruptions.\n\n* Each sample should be of around 1m (or more) of conveyor length. Each sample will have a weight between 200 to 400 kg.\n* Ensure that 100% of the sample is collected (fines and coarse) of the conveyor belt cross section. Use a broom and dustpan for final clean up.\n* As significant effort is required to stop and sample on the main conveyor it is reccommended to take 3 x coarse \"duplicates\" from the same sampling station. This allowes for;\n * Primary sample for [natural deportment](/pages/wikiore-natural-deportment) testwork\n * Secondary duplicate (or \"near duplicate\" as a true duplicate is not acheivable) for repeatability if required\n * Tertiary sample kept in reserve for follow up testwork and/or [geomet](https://en.wikipedia.org/wiki/Geometallurgy) synergies\n* Repeat this process for every [truck](https://en.wikipedia.org/wiki/Haul_truck) sample\n\n[crushing](https://en.wikipedia.org/wiki/Crusher), sub sampling and [assay](https://en.wikipedia.org/wiki/Assay)ing should follw one of the sample preparation methods discussed above.\n\n**Bulk Sample - Screen Deck Option**[](#Bulk_Sample_-_Screen_Deck_Option)\n=========================================================================\n\nBulk or small pilot trial options can be completed using a Mobile [jaw crusher](https://en.wikipedia.org/wiki/Crusher#Jaw_crusher) and a Screen Deck. The below image provides a pictorial guide.\n\nWhile suited to larger trials, and 100% of the sample is screened thus reducing the potential for bias, this method can be difficult for orientation studies due to the large sample masses generated. As 100% of the sample is seperated into size fractions, subsequent sub sampling of each pile is then required. The sub sampling method can then re-introduce substantial bias risk through partcile [segregation](https://en.wikipedia.org/wiki/Particle_segregation) on the stockpile cone, as well as biased sampling through mass reduction in the [subsample](https://en.wikipedia.org/wiki/Sub-sampling_%28chemistry%29).\n\n [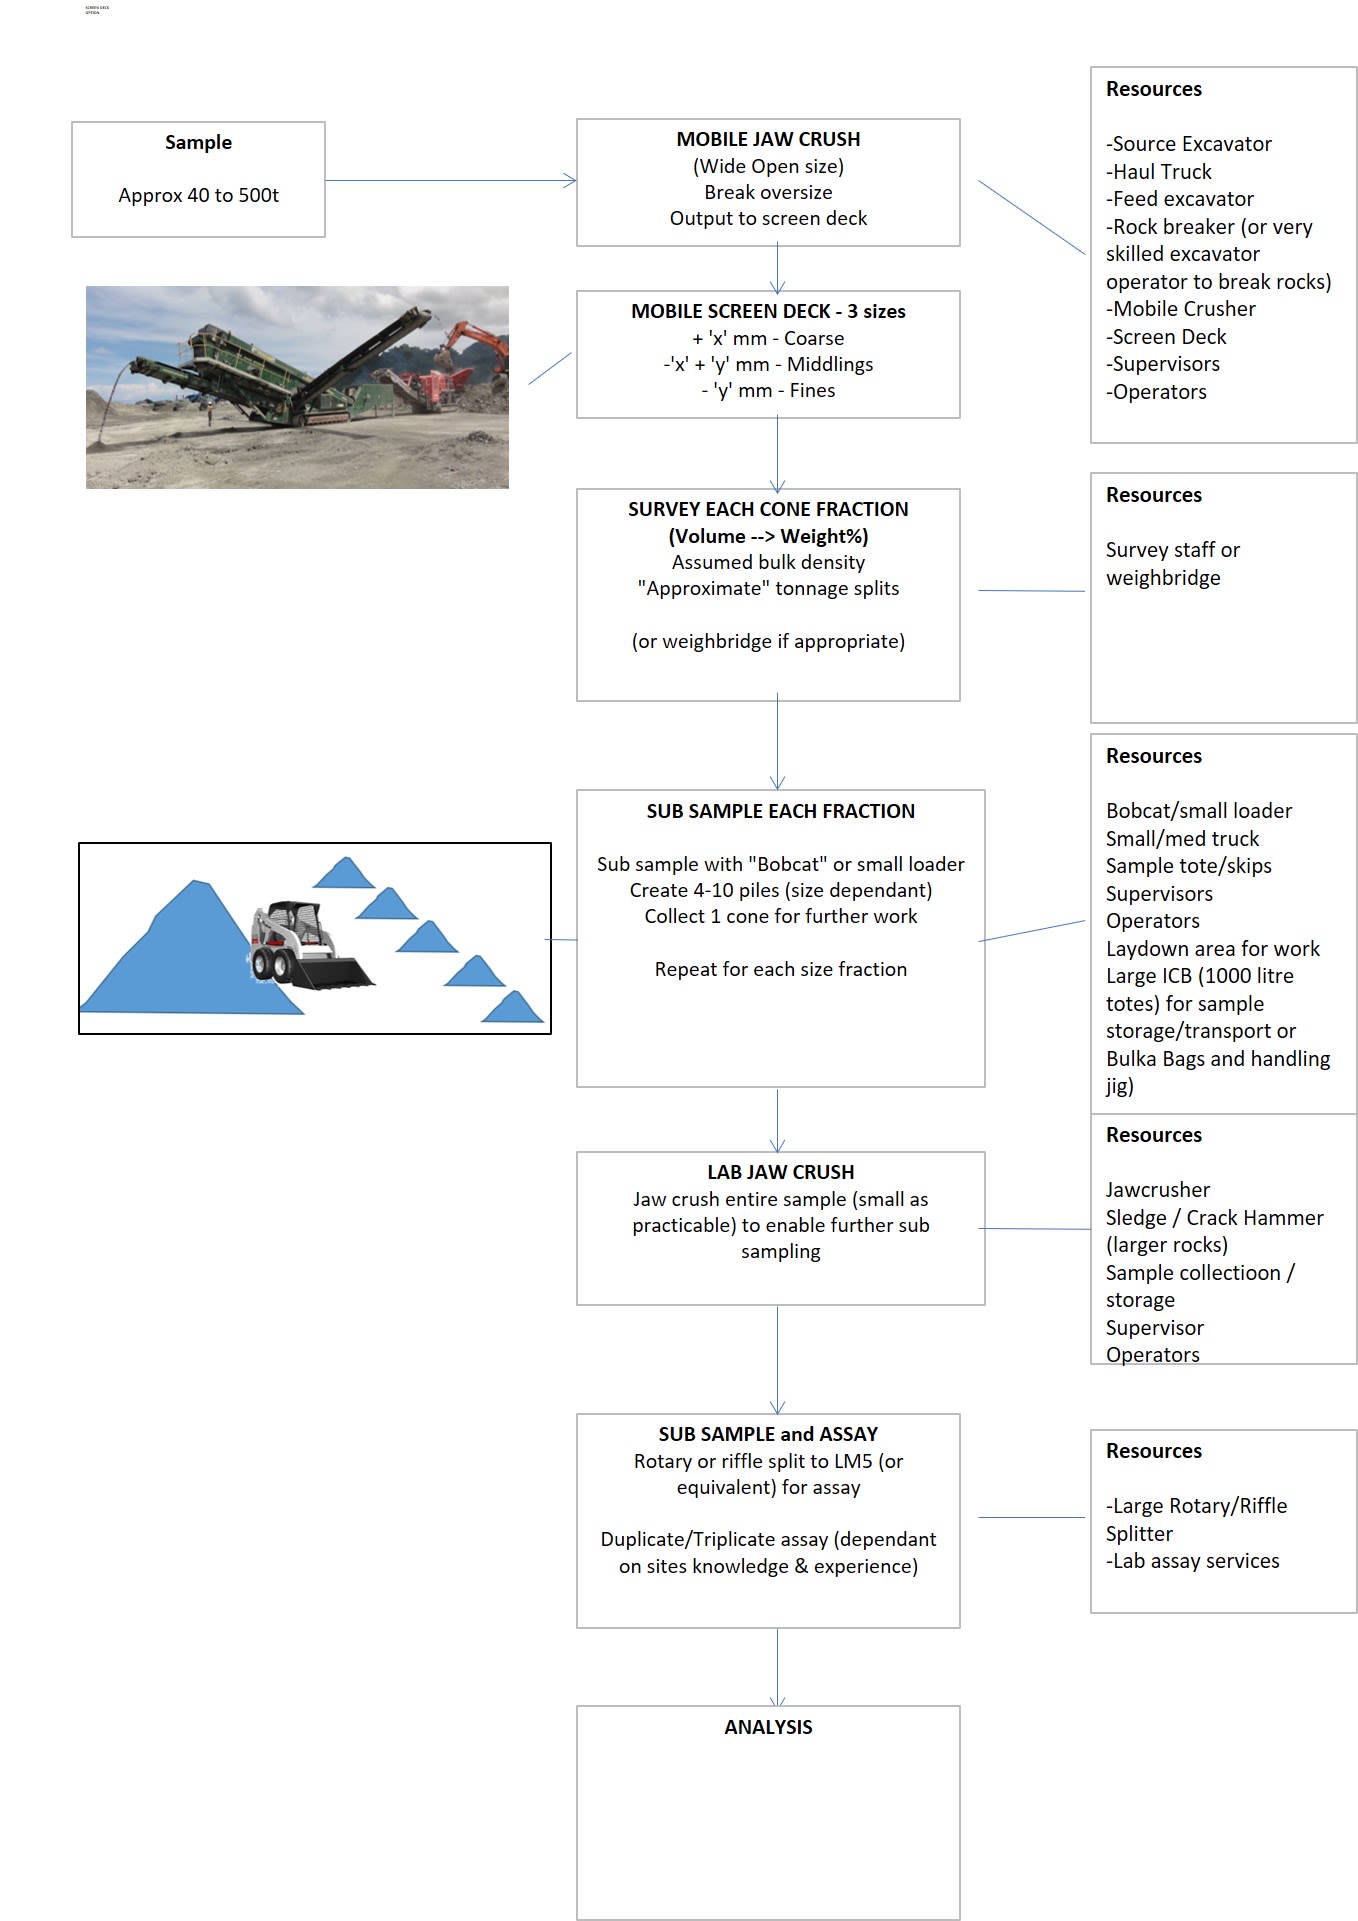](https://res.cloudinary.com/shapeable/image/upload/v1687255683/wikiore/190.jpg) \n\n**Bulk Sample – Mobile Crusher Option**[](#Bulk_Sample_Mobile_Crusher_Option)\n=============================================================================\n\nThe below discusses a methodolgy to [subsample](https://en.wikipedia.org/wiki/Sub-sampling_%28chemistry%29) directly post mobile [crushing](https://en.wikipedia.org/wiki/Crusher). Sampling via an inverted [excavator](https://en.wikipedia.org/wiki/Excavator) bucket is the prefrerred option as it reduces the bias potential due to the ability of the [excavator](https://en.wikipedia.org/wiki/Excavator) to make a single direction radial pass through the stream in freefall. Sub sampling by using a [loader](https://en.wikipedia.org/wiki/Loader_%28equipment%29) bucket to pass into the stream (either front on or side on) introduces bias potential as not all the rock stream is collected into the buccket for the same amount of time.\n\nThe below image provides a pictorial guide.\n\n [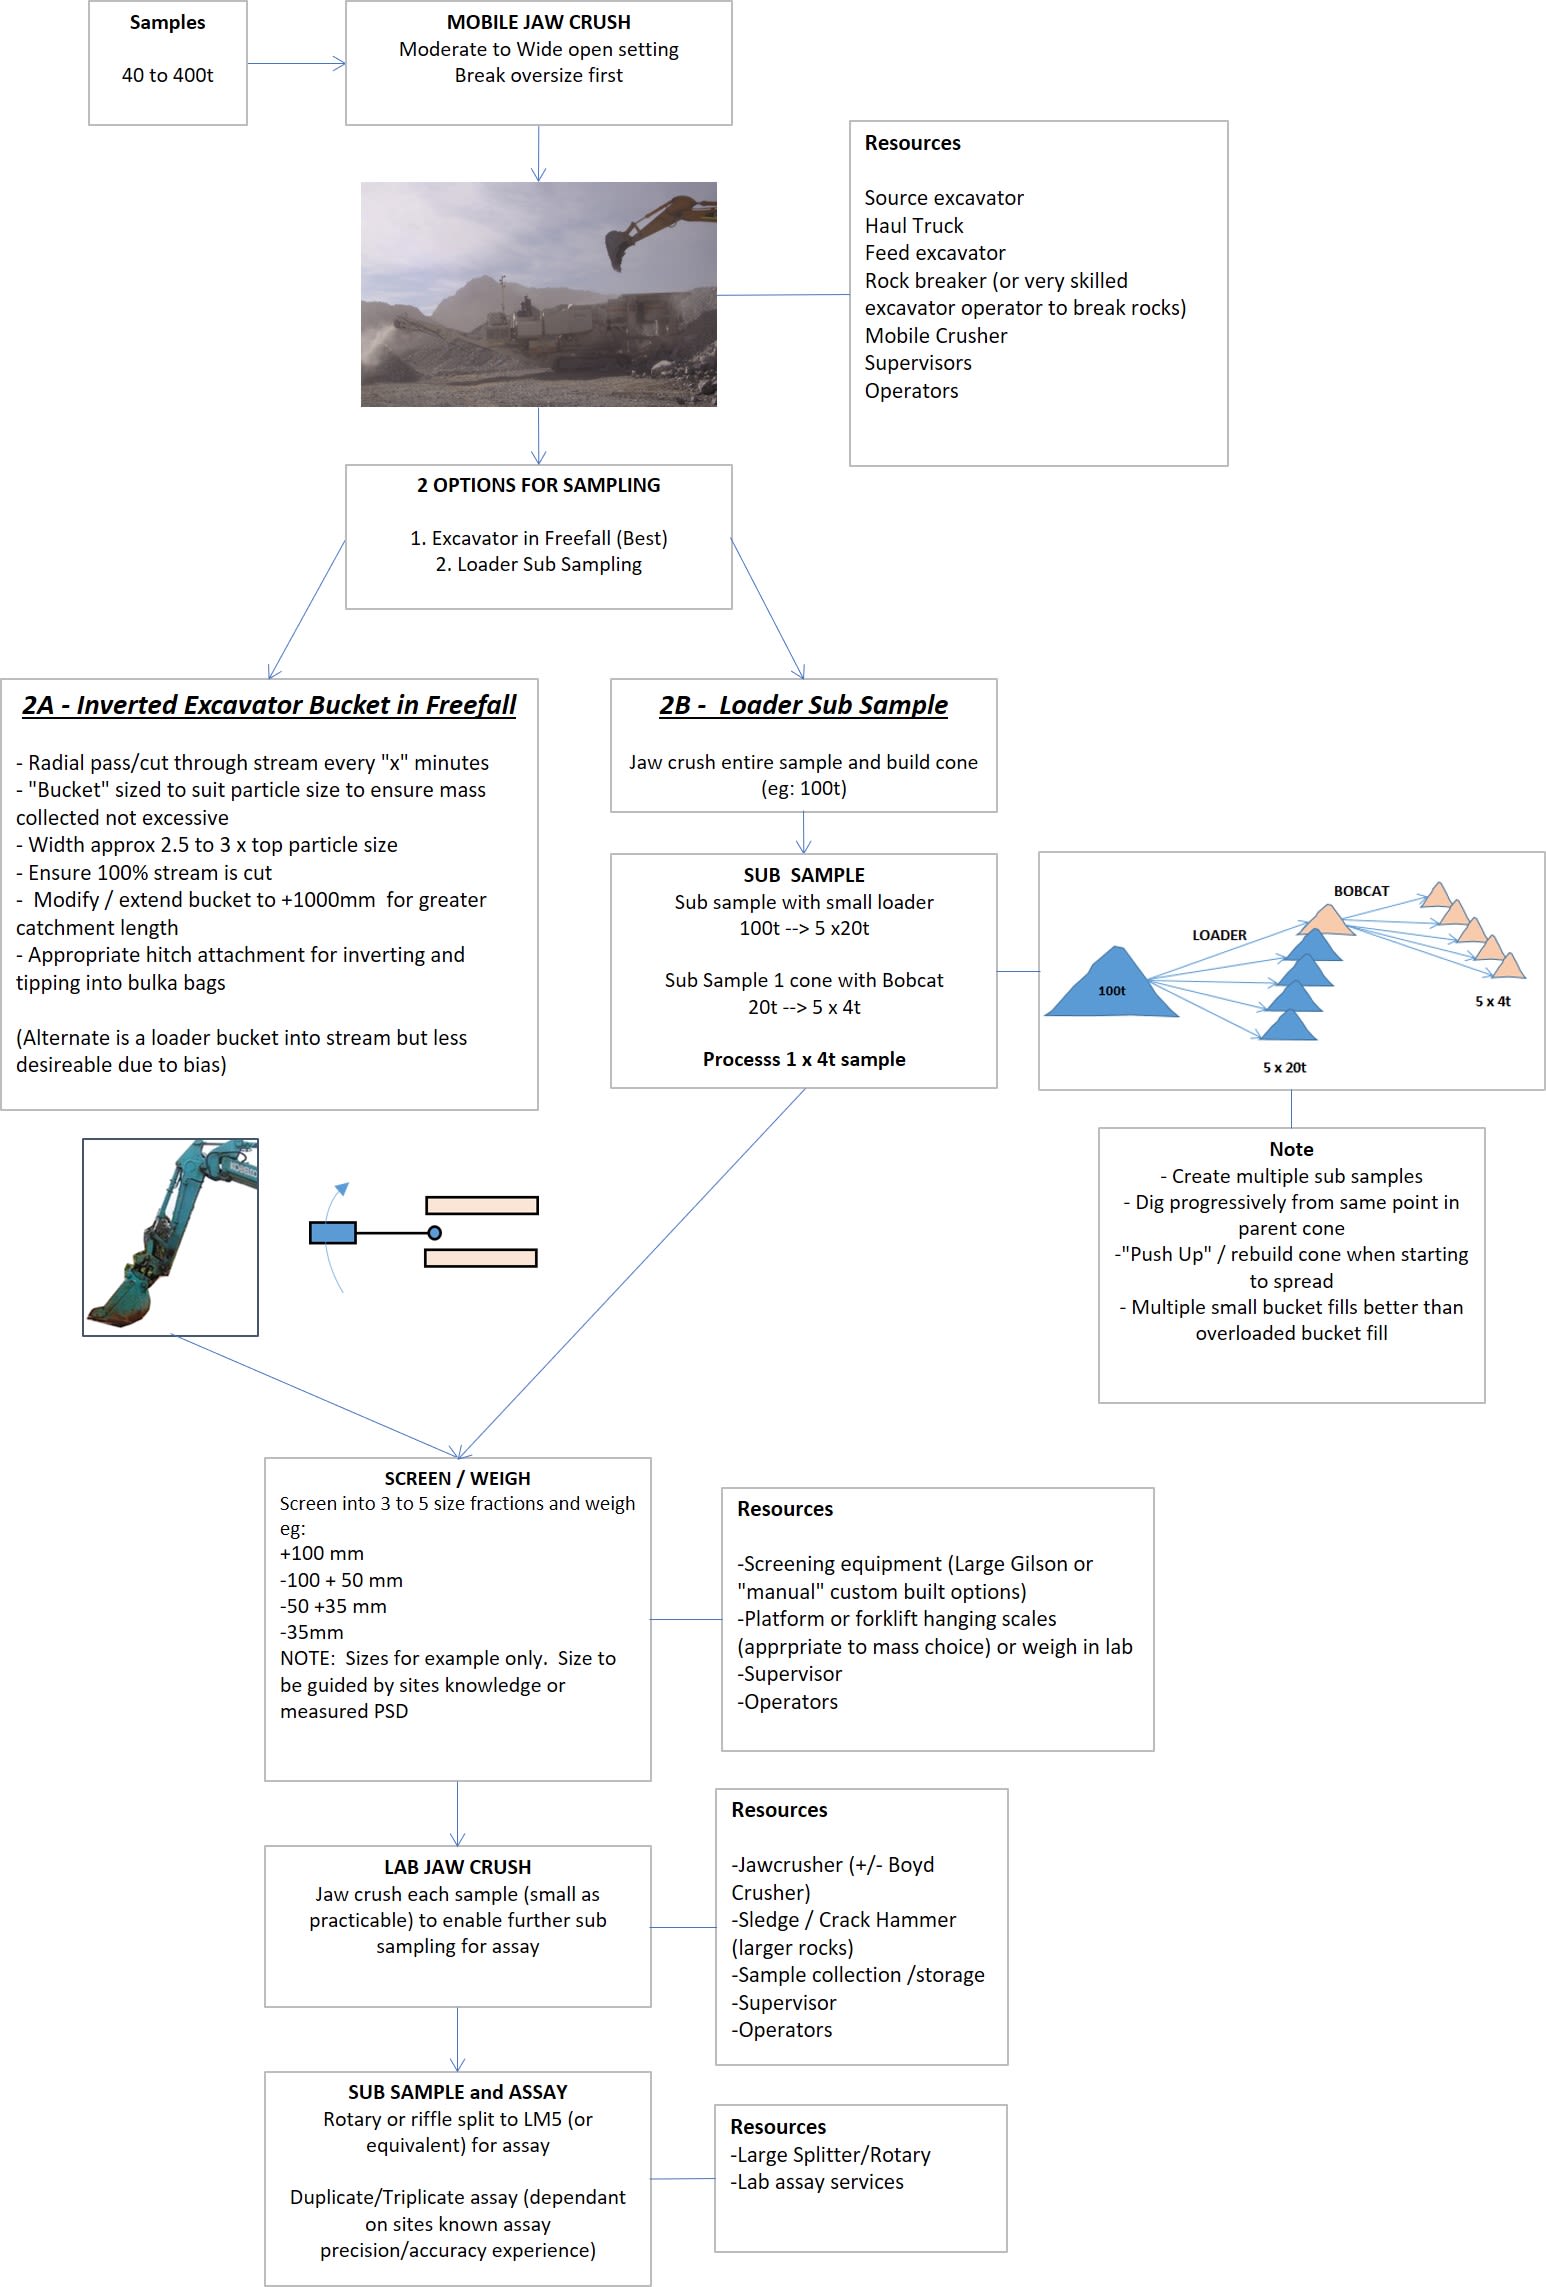](https://res.cloudinary.com/shapeable/image/upload/v1687255685/wikiore/191.jpg)"},"image":null},"intro":{"text":""},"orderNumber":null},{"__typename":"Platform_Page","id":"65d2edb6ebf7bb9388ffb036","name":"Ultimate Pit and Pushbacks","path":"/appendices/wikiore-22-ultimate-pit-and-pushbacks","slug":"wikiore-22-ultimate-pit-and-pushbacks","title":null,"subtitle":null,"pretitle":null,"openGraph":{"description":{"text":"[ultimate pit](/sub-topics/ultimate-pit-and-pushbacks) optimisation provides the first estimate of value and ore reserves for a mineral deposit. However, the [ultimate pit](/sub-topics/ultimate-pit-and-pushbacks) optimisation does not account for time-based constraints of production and the timing of cashflows for valuation. It also does not generate mineable volumes that maximise the [NPV](https://en.wikipedia.org/wiki/Net_present_value) of production. To do this, mining pushbacks are designed to provide a rudimentary sequence of extraction from the highest value to the lowest value material within the [ultimate pit](/sub-topics/ultimate-pit-and-pushbacks). The design of pushbacks also accounts for the maximum slope angles and minimum mining width of benches and provide greater detail for the optimisation of the production schedule , which accounts for time-based constraints to maximise the [NPV](https://en.wikipedia.org/wiki/Net_present_value) of production.\n\nIn the context of [Grade Engineering](/pages/wikiore-introduction-to-grade-engineering), the [ultimate pit](/sub-topics/ultimate-pit-and-pushbacks) and pushback optimisation evaluates the possible expansion of reserves due to potential changes in pit [geomet](https://en.wikipedia.org/wiki/Geometallurgy)ry and pushback design as a result of GE increasing the value of marginal material and lowering the [cut-off](/sub-topics/scheduling-and-cut-off-optimisation) grade for economic treatment of material previously classified as mineralised waste. The [Grade Engineering](/pages/wikiore-introduction-to-grade-engineering) [ultimate pit](/sub-topics/ultimate-pit-and-pushbacks) can be calculated using the [Grade Engineering](/pages/wikiore-introduction-to-grade-engineering) economic [block model](https://en.wikipedia.org/wiki/Mineral_resource_estimation#Resource_block_model) and the Lerchs-Grossman algorithm to develop a series of nested shells by adjusting the revenue factor applied to each block. These nested shells provide guidance to the selection of the [ultimate pit](/sub-topics/ultimate-pit-and-pushbacks) and design of pushbacks to be mined. The material can then be scheduled, and [cut-off](/sub-topics/scheduling-and-cut-off-optimisation) optimised, for all processing destinations in the operation.\n\nThe parameters that need to be imported from the [Grade Engineering](/pages/wikiore-introduction-to-grade-engineering) economic [block model](https://en.wikipedia.org/wiki/Mineral_resource_estimation#Resource_block_model) are the optimised maximum value ($/t) per block, and the highest value destination for each block (plant, [leach](https://en.wikipedia.org/wiki/Leaching_%28metallurgy%29)ing,waste dump, [Grade Engineering](/pages/wikiore-introduction-to-grade-engineering)). In the case that a block has chosen GE as its highest value destination, then the final destination for each of the separated streams need to be imported, together with the mass and grade for each of the streams. This information allows quantification of the amount of material that ultimately could report to ore and waste.\n\nIt is critical to note that the GE [ultimate pit](/sub-topics/ultimate-pit-and-pushbacks) and pushbacks are designed using the maximum value processing pathway for each block. This will only occur when the maximum value processing pathway is free of all constraints. In most cases the maximum value path becomes a bottleneck, meaning that material must compete for treatment at the process bottleneck. This competition introduces an opportunity cost to production through the bottleneck which raises the [cut-off](/sub-topics/scheduling-and-cut-off-optimisation) required for material to be treated at the process bottleneck. Period costs to keep processing equipment available also influence the highest net cash path.\n\nFor pit sizing, it is fair to assume, at the base of the pit the processing limits are no longer [bottlenecks](https://en.wikipedia.org/wiki/Bottleneck_%28production%29) and therefore opportunity costs of processing pathways do not need to be considered in calculating the maximum cash path for each block. Only the mining and processing, variable and period costs need to be considered. The opportunity cost to production is considered in the optimisation of the production schedule and [cut-off](/sub-topics/scheduling-and-cut-off-optimisation) grades.\n\nIncreasing Reserves Through Grade Engineering[](#Increasing_Reserves_Through_Grade_Engineering)\n===============================================================================================\n\n \n\nAccording to JORC (2014), the definition of Ore is as follows; “An ‘ore reserve ’ is the economically mineable part of a Measured and/or Indicated Mineral Resource.”\n\nTwo most used techniques to estimate the [final pit limit](/sub-topics/ultimate-pit-and-pushbacks) and reserves of a mineral resource are ‘floating cone’ and ‘Lerchs and Grossmann’. These two techniques assume as a base that mining value ($/t) of each block in a GEEBM has been calculated. This mining value ($/t) is critical in terms of economic decision during a [final pit limit](/sub-topics/ultimate-pit-and-pushbacks) optimisation. Usually mining value or maximum value ($/t) are estimated through the value equation.\n\nBlocks that have negative value ($/t) may also be considered ore if they are to be removed (economically) to access economical blocks with positive and higher value ($/t). At the same time, not every positive value ($/t) block in the resource will be considered as ore, as there might be several uneconomical blocks that need to be removed (pre-stripping) to be able to access them, therefore making those positive value blocks uneconomical. This is the logic typically followed by the ‘floating cone’ and ‘Lerchs and Grossmann’ techniques. GE pre-concentration techniques however, present the opportunity to turn uneconomical blocks into economical blocks, by turning negative blocks into positive blocks and/or by increasing the value of positive blocks. This is achieved through the [Grade Engineering](/pages/wikiore-introduction-to-grade-engineering) capability of separating blocks into a higher and lower value component and sending each of these components to the best destination to maximise the value of production.\n\nA simple example to show how these properties influence the [final pit limit](/sub-topics/ultimate-pit-and-pushbacks) optimisation process is depicted in the next figures. Figure 1 shows a 2D cross section of a GEEBM, where each block has a unique mining value ($/t) calculated with the traditional destinations (milling, [leach](https://en.wikipedia.org/wiki/Leaching_%28metallurgy%29)ing, and waste), and three different extraction pushbacks or phases. The first extraction phase commences with the red block, followed by the green phase blocks, and finishing with the yellow phase blocks. Note that blocks with positive values ($/t) at the bottom of the resource where not extracted, as they were not economically extractable. Therefore, the reserves and [final pit limit](/sub-topics/ultimate-pit-and-pushbacks) [geomet](https://en.wikipedia.org/wiki/Geometallurgy)ry are limited by the coloured blocks.\n\nFigure 2 shows the same 2D cross section but this time with Grade Engineered blocks at the bottom of the resource coloured in light red. These GE blocks have a higher value than the original blocks shown in Figure 1, which were treated with conventional economic destinations.\n\nFigure 3 shows the same GEEBM, where the FPLO finds three more economical extraction phases (light blue, yellow, and dark blue), due to the new mining value ($/t) in the blocks due to GE processing. This results in a better utilization of the resource, increment of reserves, and increment of the [final pit limit](/sub-topics/ultimate-pit-and-pushbacks) [geomet](https://en.wikipedia.org/wiki/Geometallurgy)ry.\n\n [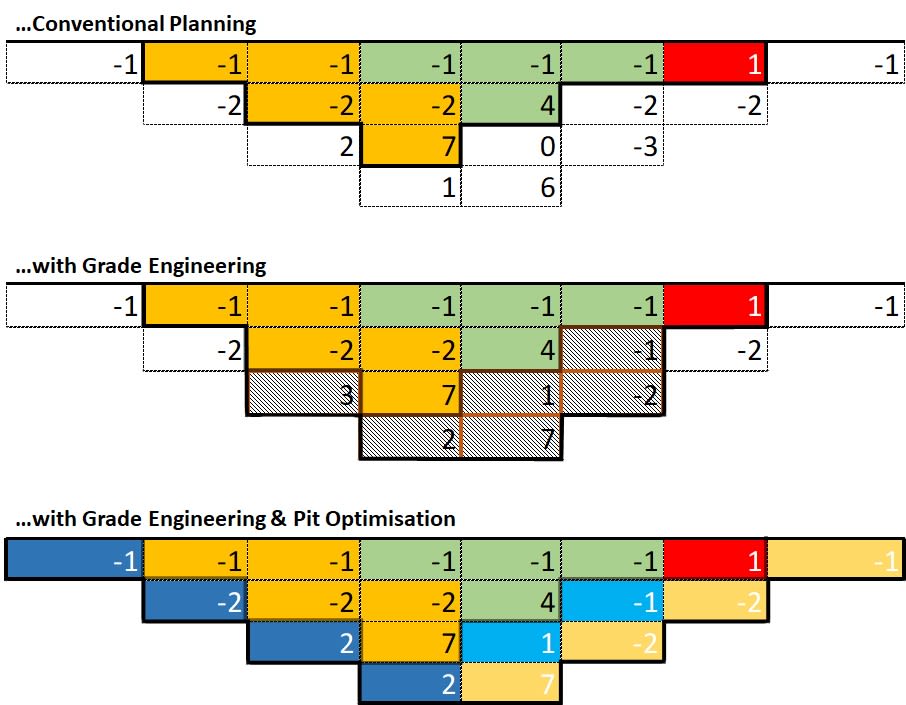](https://res.cloudinary.com/shapeable/image/upload/v1687316166/wikiore/88.jpg)"},"image":null},"intro":{"text":""},"orderNumber":null},{"__typename":"Platform_Page","id":"65d2edb6ebf7bb9388ffb02f","name":"Spatial Modelling","path":"/appendices/wikiore-spatial-modelling","slug":"wikiore-spatial-modelling","title":null,"subtitle":null,"pretitle":null,"openGraph":{"description":{"text":"Table of contents:"},"image":null},"intro":{"text":""},"orderNumber":null},{"__typename":"Platform_Page","id":"65d2edb6ebf7bb9388ffb027","name":"Participants: Research Organisations","path":"/appendices/wikiore-participants-3-a-research-organisations","slug":"wikiore-participants-3-a-research-organisations","title":null,"subtitle":null,"pretitle":null,"openGraph":{"description":{"text":"### AMIRA[](#AMIRA)\n\nAMIRA International is a global member-based, non-profit, organisation headquartered in Australia but with subsidiaries in Chile, USA, and South Africa. AMIRA International is a globally networked, independent organisation, deeply experienced in facilitating the development of solutions for its members for both technical and non-technical challenges through collaboration.\n\n[www.amira.com.au](http://www.amira.com.au)\n\n### CSIRO[](#CSIRO)\n\nCSIRO is a national science agency which uses science and research to solve issues and make a difference to industry, people and the planet. Specifically to the mining sector, CSIRO collaborates on application of new technologies, resource strategies, sensor systems and automation is improving efficiency and driving productivity gains across the minerals value chain, detailed modelling systems that respond to real world data to provide real world solutions in dynamic working environments and cost effective exploration and discovery of new mineral resources is being realised through advances and expertise in detection technologies, mineral systems, resource characterisation and data analysis.\n\n[www.csiro.au](http://www.csiro.au)\n\n### Curtin University[](#Curtin_University)\n\nCurtin University is Western Australia’s largest and most culturally diverse university with Australia’s third largest international student population. Curtin is widely recognised for its practical research that is focused on solving timely, real-world problems. In recent years our research activity has grown significantly, driving our rapid rise up the international university rankings.\n\n[www.curtin.edu.au](http://www.curtin.edu.au)\n\n### Mining3[](#Mining3)\n\nMining3 is an industry-driven, global leader in mining research and innovation. We develop and deliver breakthrough innovation and technologies that transform the productivity, sustainability and safety of the mining industry. With the unique combination of trusted industry and university members that are experienced, creative and focussed, Mining3 has the clear vision to tackle industry-wide challenges. We are flexible and responsive to the changing needs of industry priorities and work to deliver real-world solutions to the mining industry.\n\n[www.mining3.com](http://www.mining3.com)\n\n### MRIWA[](#MRIWA)\n\nThe Minerals Research Institute of Western Australia is a statutory body established by the Western Australian Government under the Minerals Research Institute of Western Australia Act 2013 to stimulate minerals research to support investment in, and operation of, a globally competitive minerals industry in Western Australia.\n\n[www.mriwa.wa.gov.au](http://www.mriwa.wa.gov.au)\n\n### NRC[](#NRC)\n\nNRC Canada. NRC Energy, Mining and Environment delivers advanced technology solutions to Canada's resource and utility sectors. NRC’s unique technology risk management capabilities help companies develop and maintain a globally competitive position, and support quality improvements and cost reductions for vital products and services.\n\n[www.nrc-cnrc.gc.ca](http://www.nrc-cnrc.gc.ca)\n\n### QUT[](#QUT)\n\nQUT is a major Australian university with a global outlook and a 'real world' focus. We are transforming the student experience we offer our 50,000 students and we place a premium on the international and national accreditation of our various professional degrees. Our internationally award-winning Science and Engineering Centre is home to The Cube, acknowledged as one of the world’s largest digital interactive learning and display spaces. QUT established the world's first Creative Industries Faculty, and we invest heavily in collaborative learning and interdisciplinary research environments.\n\n[www.qut.edu.au](http://www.qut.edu.au)\n\n### University of Adelaide[](#University_of_Adelaide)\n\nThe University of Adelaide is one of Australia’s leading research-intensive universities and is consistently ranked in the top 1% of universities in the world. Established in 1874, it is Australia’s third oldest university with a strong reputation for research and teaching excellence, and graduates that make an impact on the world.\n\n[www.adelaide.edu.au](http://www.adelaide.edu.au)\n\n### The University of Queensland[](#The_University_of_Queensland)\n\nThe University of Queensland. The world class capability of mining and minerals processing research at The University of Queensland extends back over 40 years through the activities of the Julius Kruttschnitt Mineral Research Centre (JKMRC) and the WH Bryan Mining and Geology Research Centre (BRC). In 2001 these Centres were amalgamated with four others to form the Sustainable Minerals Institute and encompass all aspects of sustainable mining practice.\n\n[www.uq.edu.au](http://www.uq.edu.au)\n\n### UTAS[](#UTAS)\n\nUTAS. The ARC Centre of Excellence in Ore Deposits (CODES) is a global leader in ore deposit research and postgraduate training. Its extensive, state of the art geological laboratory facilities enable cutting edge testing across all fields of geology.\n\n[www.utas.edu.au](http://www.utas.edu.au)"},"image":null},"intro":{"text":""},"orderNumber":null},{"__typename":"Platform_Page","id":"65d2edb6ebf7bb9388ffb030","name":"Staff","path":"/appendices/wikiore-staff","slug":"wikiore-staff","title":null,"subtitle":null,"pretitle":null,"openGraph":{"description":{"text":"**Staff name**\n\n**Position**\n\nBen Adair\n\nChief Executive Officer\n\nNick Beaton\n\nGeneral Manager IES & Program 3 Co-ordinator\n\nSuzanne Campbell\n\nBusiness Manager\n\nClytie Dangar\n\nGeneral Manager Commercialisation\n\nLuke Keeney\n\nChief Operating Officer\n\nPaul Revell\n\nGeneral Manager Research & Innovation\n\n \n\nEiman Amini\n\nIES Utilisation Manager\n\nVicki Askew\n\nProject Support/Education & Training Officer\n\nFarhad Faramarzi\n\nMining and Process Engineer\n\nBev Fogarty\n\nFinance Manager\n\nSteven Henderson\n\nCommunications Manager\n\nEdwin Koh\n\nTechnical Specialist\n\nKalin Komitski\n\nPrincipal Software Engineer\n\nDavid La Rosa\n\nPrincipal Mining Engineer\n\nNigel McBryde\n\nFront End Software Developer\n\nNaya Ojeda\n\nProject Accountant\n\nJon Rutter\n\nPrincipal Mine Geologist\n\nMichael Scott\n\nSenior Project Evaluation Specialist\n\nGreg Shapland\n\nIES Development Manager\n\nKeir Swanborough\n\nAdministration Officer\n\nRosemary Swanborough\n\nStrategy & Governance Officer\n\nPatrick Walters\n\nData Analytics Specialist\n\nClaire Waters\n\nAdmin. Officer/PA to the CEO\n\nRobert Watkins\n\nIES Chief Architect\n\nGreg Wilkie\n\nProgram Coordinator\n\nRyan Zhu\n\nFront End Software Developer"},"image":null},"intro":{"text":""},"orderNumber":null},{"__typename":"Platform_Page","id":"65d2edb6ebf7bb9388ffb031","name":"Stream Heterogeneity","path":"/appendices/wikiore-stream-heterogeneity","slug":"wikiore-stream-heterogeneity","title":null,"subtitle":null,"pretitle":null,"openGraph":{"description":{"text":"**Introduction** \n\nStream heterogeneity presents itself as variations in grade as the ore progresses through the delivery phase of the mining Value Chain (VC). Stream heterogeneity can be exploited on trucks or conveyor belts using sensor-based grade engineering levers such as bulk sorting. When ore is transported through the mining VC, heterogeneity changes from spatial heterogeneity at the mining face or bench to temporal heterogeneity during the deliver phase. Sensors are required to monitor the grade heterogeneity over time in order to make an ore/waste sorting decision \n\n**Sensors**\n\nSensors can be employed in either monitoring or intervention mode. Monitoring mode is suitable for sensing grade variations across accept and reject streams or for process control whilst intervention mode is required to make the ore/waste sorting decision. Sensors suitable for sensor-based sorting can be categorised as either surface or penetrative; and on the basis of whether they detect, identify or quantify the grade attribute/proxy as shown in the following figure.\n\n [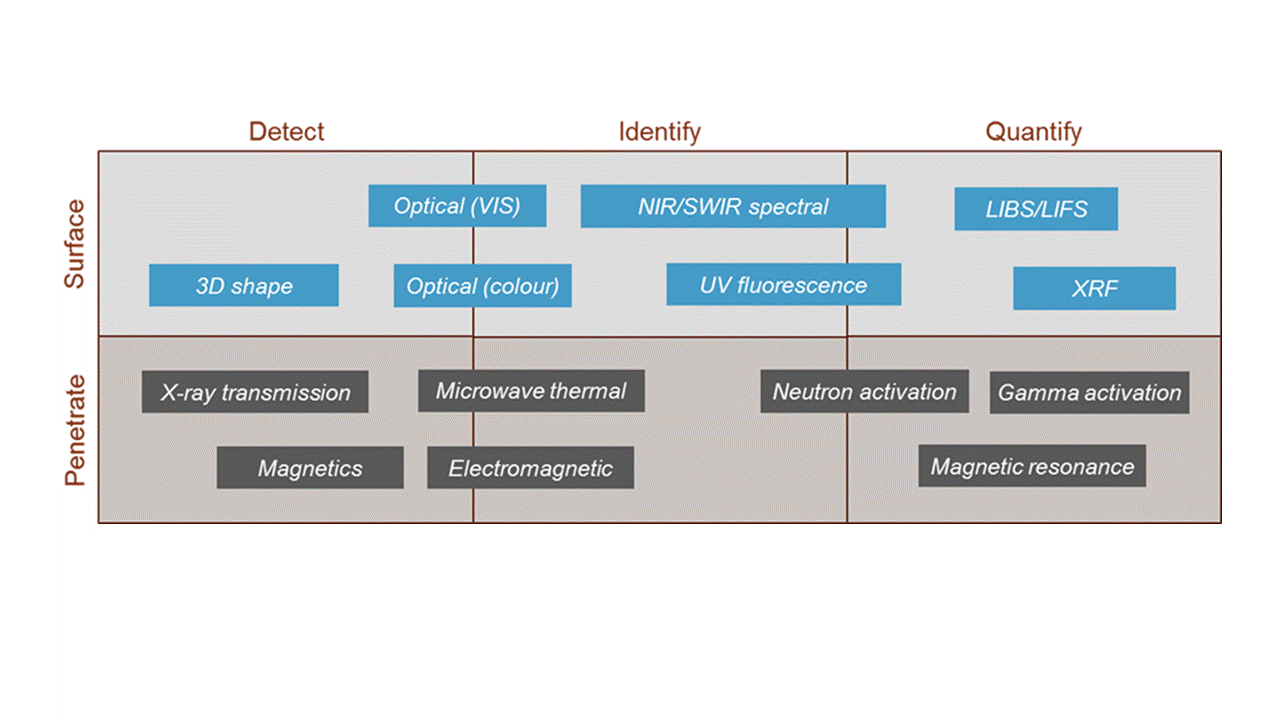](https://res.cloudinary.com/shapeable/image/upload/v1687316254/wikiore/178.gif) \n\nSurface based sensors such as the various optical and fluorescence techniques monitor the grade attribute/proxy at the surface of the broken rock mass and may therefore suffer from bias if the surface is not representative of the bulk ore. By contrast penetrative sensors such as Neutron Activation, Gamma Activation and Magnetic resonance monitor the grade attribute/proxy of the bulk material and are therefore less effected by sampling bias. The choice of which sensor technology is appropriate is dependent on the properties of the ore and the sensitivity of the sensor. Some ores exhibit excellent optical and fluorescence signatures to grade attributes/proxies which means that these relatively simple sensors are suitable for that application. Others require full quantification of the grade attribute/proxy to make the ore/waste decision. \n\n**Sensor Research** \n\nMany of the sensor technologies shown in the above diagram are mature technologies that have been applied to the mining industry to varying degrees of success over many years. These include, optical, fluorescence, X-ray transmission, magnetics and electromagnetics. More recently, new technologies have been investigated to populate the quantitative sensor space in order to make sensor based sorting more widely applicable. \n\nQuantitative sensors may also be classified based on whether they measure elements or minerals. Of these, elemental sensors such as Neutron Activation and XRF have progressed to fully commercial products whilst new elemental sensors like Gamma Activation are progressing through to site trials. New mineral sensors such as LIFS and LIBS are also being actively researched and are progressing to site trials with support from CRC ORE. \n\nTable of contents:\n\n* [Fluorescence Sensors](/pages/wikiore-fluorescence-sensors)\n \n * [P1-005 Upconversion Fluoresence](/pages/wikiore-p-1-005-upconversion-fluoresence)\n \n* [Surface Techniques for Geo-Sensing](/pages/wikiore-surface-techniques-for-geo-sensing)\n \n * [P1-007 Surface Techniques for Geosensing](/pages/wikiore-p-1-007-surface-techniques-for-geosensing)\n \n* [Flourine Sensors](/pages/wikiore-flourine-sensors)\n \n * [P1-014 Fluorine Sensor](/pages/wikiore-p-1-014-fluorine-sensor)\n \n* [Gamma Activation Analysis Sensors](/pages/wikiore-gamma-activation-analysis-sensors)\n \n * [P1-001 Gamma Activation Analysis for Geo-Sensing](/pages/wikiore-p-1-001-gamma-activation-analysis-for-geo-sensing)\n \n * [P1-009 Gold Ore Sorting Prototype](/pages/wikiore-p-1-009-gold-ore-sorting-prototype)\n \n * [P1-012 On Belt Gamma Activation Analysis Demonstration Sensing for Gold](/pages/wikiore-p-1-012-on-belt-gamma-activation-analysis-demonstration-sensing-for-gold)\n \n* [LIBS Sensor](/pages/wikiore-libs-sensor)\n \n * [P2-004 LIBS Sensor](/pages/wikiore-p-2-004-libs-sensor)\n \n * [P2-006 Cross-Belt Mineralogical Characterisation using LIBS](/pages/wikiore-p-2-006-cross-belt-mineralogical-characterisation-using-libs)"},"image":null},"intro":{"text":""},"orderNumber":null},{"__typename":"Platform_Page","id":"65d2edb6ebf7bb9388ffb033","name":"Surface Techniques for Geo-Sensing","path":"/appendices/wikiore-surface-techniques-for-geo-sensing","slug":"wikiore-surface-techniques-for-geo-sensing","title":null,"subtitle":null,"pretitle":null,"openGraph":{"description":{"text":"Table of contents:\n\n* [P1-007 Surface Techniques for Geosensing](/pages/wikiore-p-1-007-surface-techniques-for-geosensing)"},"image":null},"intro":{"text":""},"orderNumber":null},{"__typename":"Platform_Page","id":"65d2edb6ebf7bb9388ffb032","name":"Students","path":"/appendices/wikiore-students","slug":"wikiore-students","title":null,"subtitle":null,"pretitle":null,"openGraph":{"description":{"text":" [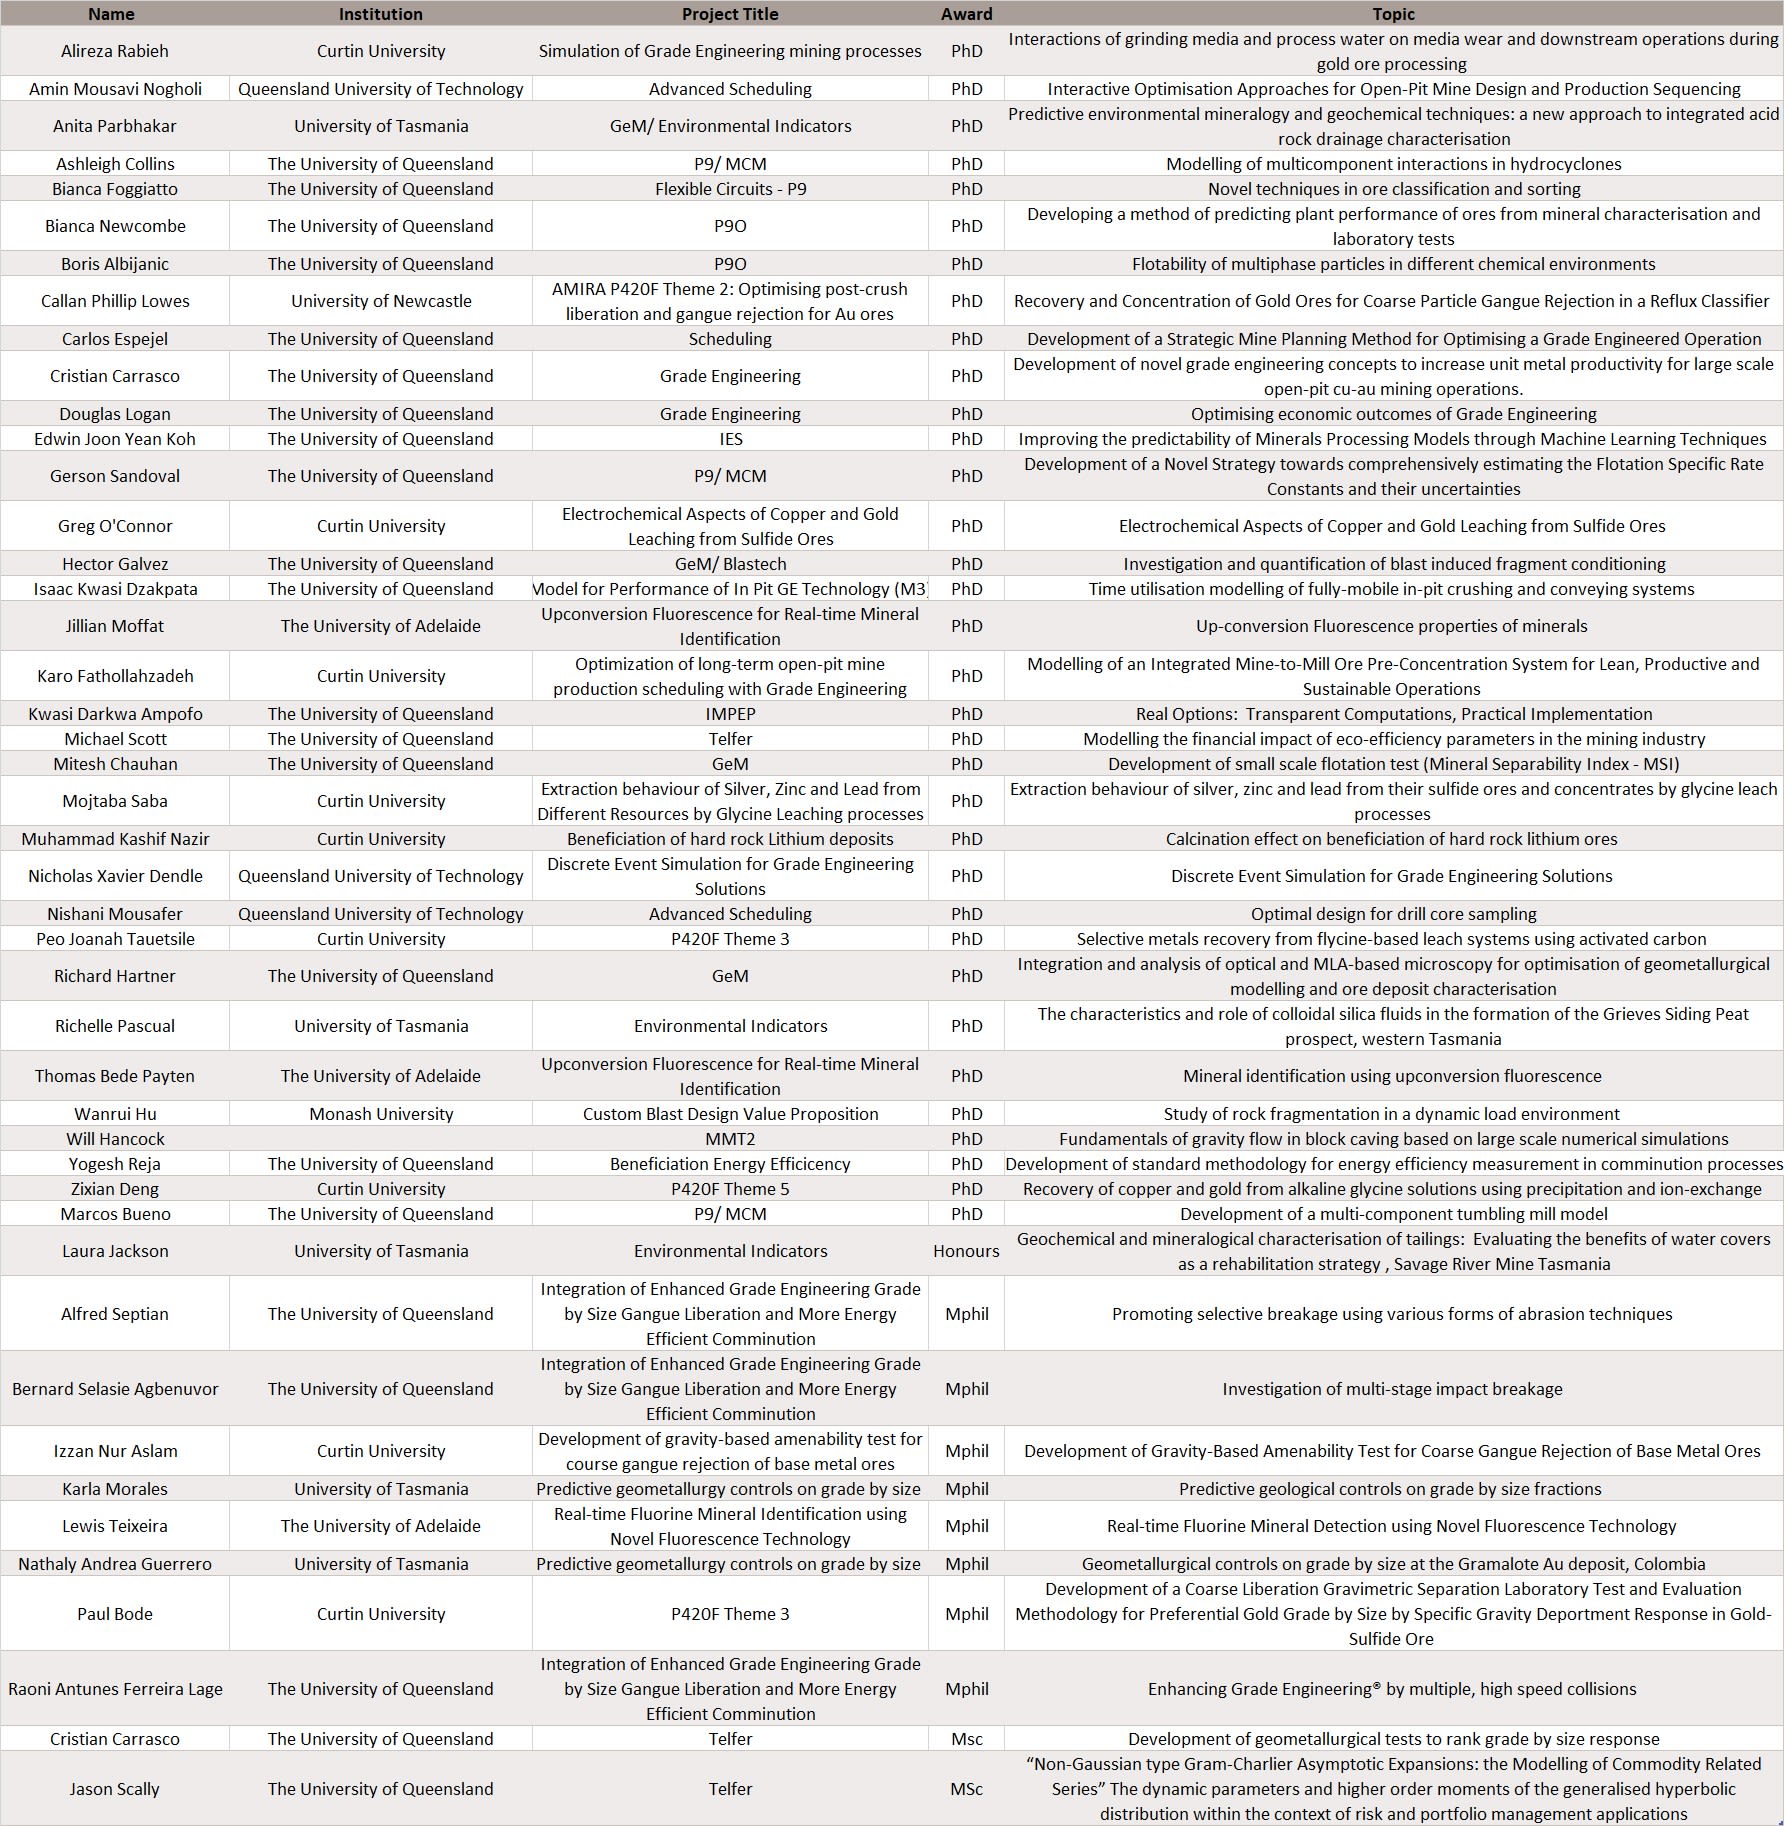](https://res.cloudinary.com/shapeable/image/upload/v1687306232/wikiore/322.jpg)"},"image":null},"intro":{"text":""},"orderNumber":null},{"__typename":"Platform_Page","id":"65d2edb6ebf7bb9388ffb028","name":"Particle Sorting","path":"/appendices/wikiore-particle-sorting","slug":"wikiore-particle-sorting","title":null,"subtitle":null,"pretitle":null,"openGraph":{"description":{"text":"**[Natural Deportment](/pages/wikiore-natural-deportment) | [Induced Deportment](/pages/wikiore-induced-deportment) | [Bulk Sorting](/pages/wikiore-bulk-sorting) | [Particle Sorting](/pages/wikiore-particle-sorting) | [Gravity Separation](/pages/wikiore-gravity-separation)**\n\n[particle sorting](https://en.wikipedia.org/wiki/Sensor-based_sorting) involves utilising sensors capable of providing on-line information on grade (or a proxy of) within a narrow [particle size](https://en.wikipedia.org/wiki/Particle_size) range of material post blast. This narrow size range is driven by the requirements of some sensor technologies for a limited size distribution to improve rock interaction and enable individual particle separation using air jets or mechanical actuators. It is driven by stream [heterogeneity](/pages/wikiore-heterogeneity) and as such accesses a different opportunity than other screening levers. Complementary to other levers [particle sorting](https://en.wikipedia.org/wiki/Sensor-based_sorting) can be used as a ‘cleaner’ on lower volume separated streams.\n\n \n \nFor Characterisation methods for Particle Sorting click [HERE](/sub-topics/particle-sorting-characterisation).\n\n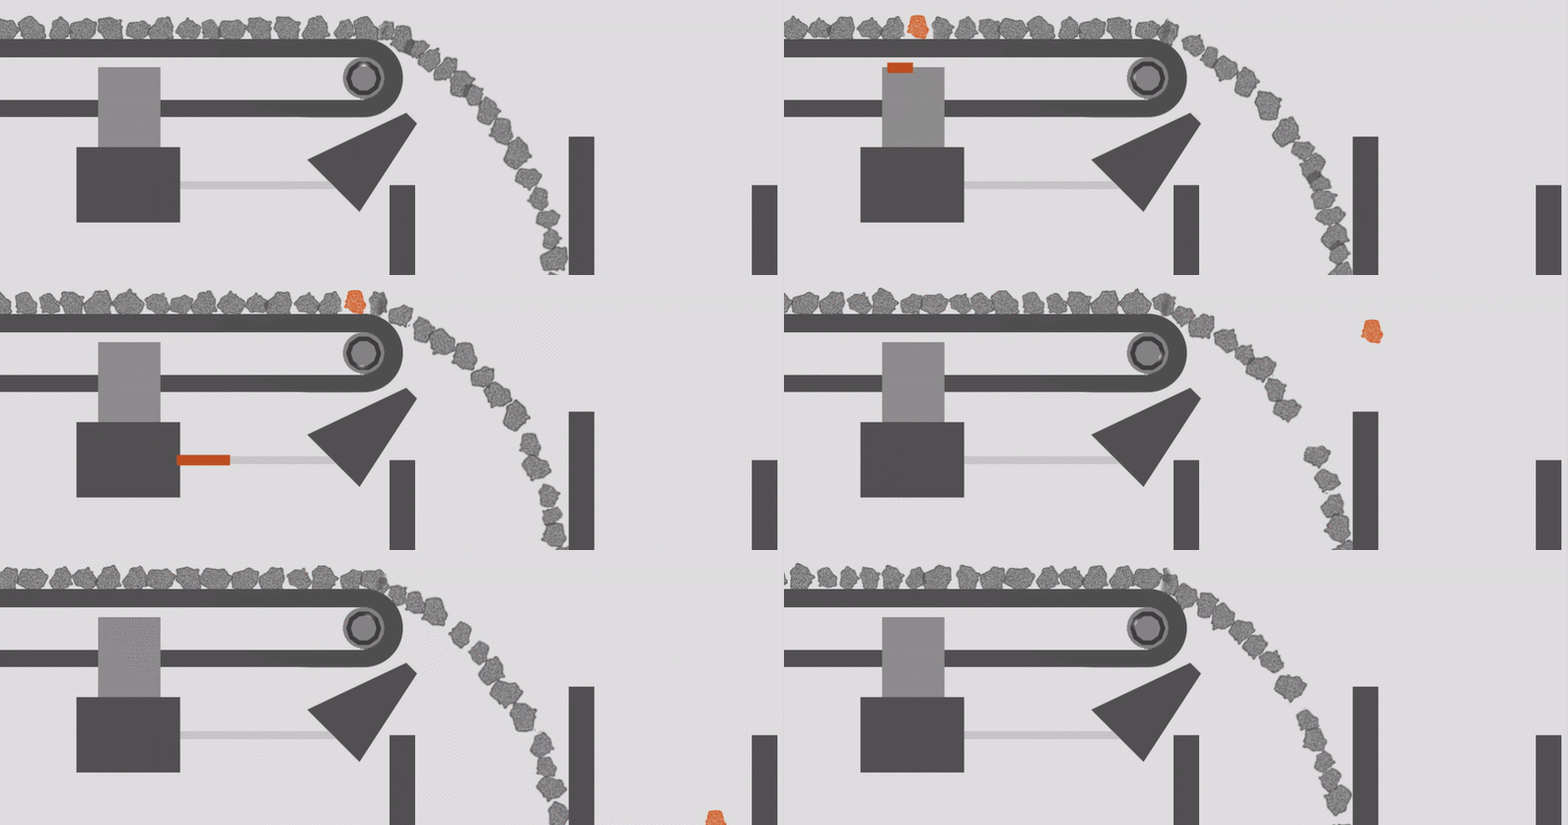"},"image":null},"intro":{"text":""},"orderNumber":null}]},"bannerLinks":[],"cardLinks":[],"children":[],"slices":[],"followersCount":0,"comments":[]}}},"pageContext":{"lang":{"id":"en","path":"","iso":"en","name":"English","label":"English"},"availableEntities":["Catalyst","CommodityGroup","Innovation","Organisation","Page","Person","Post","SubTopic","Topic","Trend","OrganisationType","HorizonType","Economy","FeedEntry","Video","Citation","Objective","ProfileType","ExpertiseLevel"],"detailEntities":["Catalyst","CommodityGroup","Innovation","Organisation","Page","Person","Post","SubTopic","Topic","Trend"],"site":{"id":"65d2edd1ebf7bb9388ffb0df","slug":"connect-ore","name":"ConnectOre","url":"https://connectore.org","title":"ConnectOre","twitter":null,"threads":null,"facebook":null,"linkedin":null,"instagram":null,"flickr":null,"tiktok":null,"youtube":null,"ownerName":"ICAA","recaptchaKey":"6LfG2J0qAAAAAHDCFfJnrWOj6DiWJGik5BAa_7p8","googleSiteVerification":null,"platformName":"ConnectOre","platformUrl":"https://platform.connectore.org","supportEmail":null,"contactEmail":null,"mainMenu":{"id":"65d2edaaebf7bb9388ffaf79","slug":"website-navigation"},"linearMenu":null,"entityViews":[{"id":"67528c24c135ebcfc668f1ba_65d2edd1ebf7bb9388ffb0df","name":"Value Chain","hash":"value-chain","label":null,"slug":"value-chain","count":0,"showCount":null,"disabled":null,"icon":{"id":"6752a61b8b51dfa7b77b1e37","name":"Connections Navigator Icon Glyph","slug":"connections-navigator-icon-glyph","component":"ConnectionsNavigatorIconGlyph"},"childEntityTypes":[{"id":"6667fa4ff794dd6e045135c1","name":"Value Chain Theme","internalName":"Trend"},{"id":"6667fa58f794dd6e045135c6","name":"Topic","internalName":"Topic"}],"type":{"id":"67528b63c135ebcfc668f19c","name":"Explorer","slug":"explorer"},"slices":[]},{"id":"6757ef1ede8adbd45cf19474_65d2edd1ebf7bb9388ffb0df","name":"Bulletin Board","hash":"bulletin-board","label":null,"slug":"bulletin-board","count":0,"showCount":null,"disabled":null,"icon":{"id":"681c2cebbccc5a72d8382f31","name":"Tag Icon","slug":"tag-icon","component":"TagDotIconGlyph"},"childEntityTypes":[],"type":{"id":"67528b63c135ebcfc668f19c","name":"Explorer","slug":"explorer"},"slices":[]},{"id":"67528d88c135ebcfc668f31b_65d2edd1ebf7bb9388ffb0df","name":"Innovations","hash":"innovations","label":null,"slug":"innovations","count":0,"showCount":null,"disabled":null,"icon":{"id":"67528cddc135ebcfc668f304","name":"Grid Icon Glyph","slug":"grid-icon-glyph","component":"GridIconGlyph"},"childEntityTypes":[{"id":"67528d74c135ebcfc668f315","name":"Innovation","internalName":"innovation"}],"type":{"id":"67528b63c135ebcfc668f19c","name":"Explorer","slug":"explorer"},"slices":[]},{"id":"67625640fbc7c50d8644c592_65d2edd1ebf7bb9388ffb0df","name":"Community","hash":"community","label":null,"slug":"community","count":0,"showCount":null,"disabled":null,"icon":{"id":"67528cddc135ebcfc668f304","name":"Grid Icon Glyph","slug":"grid-icon-glyph","component":"GridIconGlyph"},"childEntityTypes":[{"id":"67528404c135ebcfc668ee1c","name":"Person","internalName":"Person"}],"type":{"id":"67528b63c135ebcfc668f19c","name":"Explorer","slug":"explorer"},"slices":[]},{"id":"67528e1bc135ebcfc668f33a_65d2edd1ebf7bb9388ffb0df","name":"Stakeholder Map","hash":"stakeholder-map","label":null,"slug":"stakeholder-map","count":0,"showCount":null,"disabled":null,"icon":{"id":"67528cddc135ebcfc668f304","name":"Grid Icon Glyph","slug":"grid-icon-glyph","component":"GridIconGlyph"},"childEntityTypes":[{"id":"66680141f794dd6e0451367a","name":"Organisation","internalName":"Organisation"}],"type":{"id":"67528b63c135ebcfc668f19c","name":"Explorer","slug":"explorer"},"slices":[]},{"id":"67529040c135ebcfc668f4ae_65d2edd1ebf7bb9388ffb0df","name":"References","hash":"references","label":null,"slug":"references","count":0,"showCount":null,"disabled":null,"icon":{"id":"67528cddc135ebcfc668f304","name":"Grid Icon Glyph","slug":"grid-icon-glyph","component":"GridIconGlyph"},"childEntityTypes":[{"id":"6752902fc135ebcfc668f4a4","name":"Article","internalName":"FeedEntry"},{"id":"67529039c135ebcfc668f4aa","name":"Citation","internalName":"Citation"},{"id":"67528de9c135ebcfc668f328","name":"Catalyst","internalName":"catalyst"},{"id":"67528df9c135ebcfc668f32d","name":"Page","internalName":"page"}],"type":{"id":"67528b63c135ebcfc668f19c","name":"Explorer","slug":"explorer"},"slices":[]}],"entityAppViews":[],"entityOnboardingViews":[{"id":"680c3a4ebc80e4d0f3cfa2ef_65d2edd1ebf7bb9388ffb0df","name":"Trend Expertise Step","hash":"trend-expertise-step","label":null,"slug":"trend-expertise-step","count":0,"showCount":null,"icon":null,"childEntityTypes":[],"type":{"id":"680c394fbc80e4d0f3cfa2d8","name":"Onboarding","slug":"onboarding"},"slices":[{"id":"680c39f2bc80e4d0f3cfa2e0_65d2edd1ebf7bb9388ffb0df","name":"Trend Expertise Onboarding Grid","slug":"trend-expertise-onboarding-grid","label":null,"updated":"2025-04-26T01:42:10.20","layout":{"id":"680c3993bc80e4d0f3cfa2dd","name":"Slice Onboarding Trend Expertise Grid","slug":"slice-onboarding-trend-expertise-grid","component":"SliceLayoutOnboardingTrendExpertiseGrid"},"connectedEntities":[],"headerFontType":null,"pretitle":null,"pretitleRich":{"id":"680c39f2bc80e4d0f3cfa2e0_65d2edd1ebf7bb9388ffb0df_pretitleRich","text":""},"title":null,"titleRich":{"id":"680c39f2bc80e4d0f3cfa2e0_65d2edd1ebf7bb9388ffb0df_titleRich","text":"Are you **an industry expert** in any of these Value Chain Themes?"}}]},{"id":"680c3a85bc80e4d0f3cfa2fa_65d2edd1ebf7bb9388ffb0df","name":"Profile Types Step","hash":"profile-types-step","label":null,"slug":"profile-types-step","count":0,"showCount":null,"icon":null,"childEntityTypes":[],"type":{"id":"680c394fbc80e4d0f3cfa2d8","name":"Onboarding","slug":"onboarding"},"slices":[{"id":"680c3a82bc80e4d0f3cfa2f7_65d2edd1ebf7bb9388ffb0df","name":"Profile Types Onboarding Grid","slug":"profile-types-onboarding-grid","label":null,"updated":"2025-04-26T01:44:34.63","layout":{"id":"680c3a13bc80e4d0f3cfa2e4","name":"Slice Onboarding Profile Types Grid","slug":"slice-onboarding-profile-types-grid","component":"SliceLayoutOnboardingProfileTypesGrid"},"connectedEntities":[],"headerFontType":null,"pretitle":null,"pretitleRich":{"id":"680c3a82bc80e4d0f3cfa2f7_65d2edd1ebf7bb9388ffb0df_pretitleRich","text":""},"title":"Which best describes you?","titleRich":{"id":"680c3a82bc80e4d0f3cfa2f7_65d2edd1ebf7bb9388ffb0df_titleRich","text":""}}]},{"id":"680c3aaabc80e4d0f3cfa2ff_65d2edd1ebf7bb9388ffb0df","name":"Objectives Step","hash":"objectives-step","label":null,"slug":"objectives-step","count":0,"showCount":null,"icon":null,"childEntityTypes":[],"type":{"id":"680c394fbc80e4d0f3cfa2d8","name":"Onboarding","slug":"onboarding"},"slices":[{"id":"680c3aa8bc80e4d0f3cfa2fc_65d2edd1ebf7bb9388ffb0df","name":"Objectives Onboarding Grid","slug":"objectives-onboarding-grid","label":null,"updated":"2025-04-26T01:45:12.76","layout":{"id":"680c3a3fbc80e4d0f3cfa2ea","name":"Slice Onboarding Objectives Grid","slug":"slice-onboarding-objectives-grid","component":"SliceLayoutOnboardingObjectivesGrid"},"connectedEntities":[],"headerFontType":null,"pretitle":null,"pretitleRich":{"id":"680c3aa8bc80e4d0f3cfa2fc_65d2edd1ebf7bb9388ffb0df_pretitleRich","text":""},"title":"What are your priority objectives?","titleRich":{"id":"680c3aa8bc80e4d0f3cfa2fc_65d2edd1ebf7bb9388ffb0df_titleRich","text":""}}]}],"gptLanguages":[{"id":"65d2eda5ebf7bb9388ffaf1f","name":"English","slug":"english","iso":"en","locale":"en_US","path":"/en","label":"English","menuLabel":null},{"id":"666f70b6e051ad9ef086d1be","name":"Arabic","slug":"arabic","iso":"ar","locale":"ar_AE","path":"/ar","label":"عربي","menuLabel":null},{"id":"666f7161e051ad9ef086d1c4","name":"Spanish","slug":"spanish","iso":"es","locale":"es_ES","path":"/es","label":"español","menuLabel":null},{"id":"666f71c9e051ad9ef086d1c8","name":"German","slug":"german","iso":"de","locale":"de_DE","path":"/de","label":"Deutsch","menuLabel":null},{"id":"65d2eda5ebf7bb9388ffaf20","name":"French","slug":"french","iso":"fr","locale":"fr_FR","path":"/fr","label":"Français","menuLabel":null}],"gptQuestionTemplate":{"id":"662c7f6e81ef1920e3638518","name":"Standard Open Question","slug":"standard-open-question","path":"/prompt-templates/standard-open-question","__typename":"PromptTemplate","_entityTypeName":null,"label":"CopperAI","type":{"id":"662c7f1981ef1920e363850f","name":"Ask","slug":"ask"},"description":{"text":"This template is tailored for providing accurate responses based on specific context. It integrates contextual details from \"contextual information\" and addresses the \"target question\". The response is always in English, prioritizing clarity. If the answer is unknown, the template openly acknowledges this, ensuring honesty and avoiding speculation. This format is ideal for precise, context-sensitive, and truthful answering."},"summary":{"text":"Ask a general question about Website content"},"gptModel":{"id":"67564c4f2f6749787d0e03dc","name":"OpenAI GPT 4o","slug":"open-ai-gpt-4-o","dataSetId":"openai:gpt-4o"},"variablesPrompt":{"text":""},"submitLabel":"Ask","languages":[],"icon":{"id":"67528b9cc135ebcfc668f1a3","name":"AI Lower Case Icon Glyph","slug":"ai-lower-case-icon-glyph","component":"AiLowerCaseIconGlyph"},"variables":[{"id":"6668076bf794dd6e045138d9","name":"question","slug":"question","useVectorStore":true,"label":"What would you like to know?","labelAnother":null,"help":{"text":""},"options":{"text":""},"defaultValue":null,"entityTypes":[],"controlType":{"id":"6667ff19f794dd6e04513656","name":"Textarea","slug":"textarea"},"labelContextual":null,"labelAnotherContextual":null,"helpContextual":{"text":""},"optionsContextual":{"text":""},"defaultValueContextual":null,"entityTypesContextual":[],"controlTypeContextual":{"id":"6667ff19f794dd6e04513656","name":"Textarea","slug":"textarea"}}]},"advertisements":[],"logoVerticalOffset":null,"logoHorizontalOffset":null,"logoVerticalOffsetMobile":null,"logoHorizontalOffsetMobile":null,"logoVerticalOffsetTablet":null,"logoHorizontalOffsetTablet":null,"logoVerticalOffsetDesktop":null,"logoHorizontalOffsetDesktop":null,"logoHeightMobile":44,"logoHeightTablet":null,"logoHeightDesktop":null,"headerHeightMobile":null,"headerHeightTablet":null,"headerHeightDesktop":null,"logo":{"url":"https://res.cloudinary.com/shapeable/image/upload/v1738807465/copper-connect/site/copper-connect_logo__CopperOre_Master_Brand_Identity-colour_cd4vgg.webp","type":"image/webp","width":945,"height":266},"logoInverted":{"url":"https://res.cloudinary.com/shapeable/image/upload/v1738807452/copper-connect/site/copper-connect_logoInverted__CopperOre_Master_Brand_Identity-white_chnucx.webp","type":"image/webp","width":945,"height":266},"footerMenu":null,"footerSecondaryMenu":null,"footerContent":{"text":"© {year} ConnectOre. All Rights Reserved\n"},"creator":null,"poweredBy":{"id":"65d2edadebf7bb9388ffafc8","name":"Shapeable","slug":"shapeable","url":"https://shapeable.ai","logo":{"url":"https://res.cloudinary.com/shapeable/image/upload/v1674010034/platform/organisation/shapeable_logo__shapeable.png","type":"image/png","width":1174,"height":368},"logoInverted":{"url":"https://res.cloudinary.com/shapeable/image/upload/v1729474494/copper-connect/organisation/shapeable_logoInverted__shapeable-logo-inverted_sdcfpk.png","type":"image/png","width":392,"height":118},"logoSubtle":null},"poweredByLabel":null,"poweredByContent":{"text":""},"explorerPage":{"name":"Explorer","title":null,"slug":"explorer","path":"/explorer"},"termsPage":{"name":"Terms of Use","title":null,"slug":"terms-of-use","path":"/terms-of-use"},"homePage":null,"knowledgeHubPage":{"name":"News","title":null,"slug":"news","path":"/news"},"privacyPolicyPage":{"name":"Privacy Policy","title":null,"slug":"privacy-policy","path":"/privacy-policy"},"summary":{"text":"A platform to accelerate industry-wide innovation through collective intelligence and collaborative action"},"thumbnail":{"url":"https://res.cloudinary.com/shapeable/image/upload/v1713942350/copper-connect/site/copper-connect_thumbnail__site-thumb_bmicl8.png"},"openGraph":{"title":"ConnectOre","date":"2026-07-31T04:44:47.80","description":{"plain":"A platform to accelerate industry-wide innovation through collective intelligence and collaborative action\n"},"image":{"url":"https://res.cloudinary.com/shapeable/image/upload/v1713942350/copper-connect/site/copper-connect_thumbnail__site-thumb_bmicl8.png","type":"image/png","thumbnails":{"full":{"url":"https://res.cloudinary.com/shapeable/image/upload/v1713942350/copper-connect/site/copper-connect_thumbnail__site-thumb_bmicl8.png"}}}},"termsAndConditions":{"text":""},"privacyPolicy":{"text":"At ConnectOre we respect your privacy. We want to ensure that you get the information, content, and experiences that matter most to you. ConnectOre is committed to protecting the privacy of its stakeholders, communities, and other contacts.\n\n## Scope\n\nThis privacy policy applies to all personal data processed by full-time and part-time employees, volunteers when acting on behalf of ConnectOre contractors and partners doing business on behalf of ConnectOre, as well as all legal entities, all operating locations in all countries, and all business processes conducted by ConnectOre.\n\n## Information Collected\n\n#### What information do we collect?\n\nConnectOre collects the following personal data in line with the use purposes explained in a subsequent section:\n\n * Your name and contact details\n * Online profile data/usage\n * Contact information\n * Social media profile information\n * Education and professional information\n * Registration and participation in ConnectOre events and activities \n * Information about service usage\n * Cookies\n * Authentication data\n * Location information\n * Author and peer review information\n * Other information you upload or provide to us\n\n#### How do we use your information?\n\nConnectOre uses (and, where specified, shares) your personal information for the following purposes:\n\n * To provide support or other services. ConnectOre may use your personal information to provide you with support or other services that you have ordered or requested. ConnectOre may also use your personal information to respond directly to your requests for information, including registrations for webinars, or other specific requests, or pass your contact information to the appropriate ConnectOre supplier or reseller for further follow-up related to your interests.\n * To provide information based on your needs and respond to your requests. ConnectOre may use your personal information to provide you with notices of new product releases and service developments.\n * To administer products. ConnectOre may contact you if you make use of (digital) products we offer, to confirm certain information (for example, that you did not experience problems in a download process). We may also use this information to confirm compliance with licensing and other terms of use and may share it with your company/institution.\n * To assist in your participation in ConnectOre activities. ConnectOre will communicate with you, if you are participating in certain ConnectOre activities such as ConnectOre Summit, authoring or reviewing a ConnectOre article, or ConnectOre humanitarian activities. ConnectOre may send you information such as update messages related to those activities (such as but not limited to the event's content, and event logistics)\n * To update you on relevant ConnectOre events and opportunities. ConnectOre may communicate with you regarding relevant ConnectOre events and opportunities.\n * To protect ConnectOre content and services. We may use your information to prevent potentially illegal activities and to enforce our terms and conditions.\n * To get feedback or input from you. In order to deliver products and services of most interest to our stakeholders, from time to time, we may ask you to provide us input and feedback (for example through surveys).\n\n#### How can you control your information?\n\nYou can control the information we have about you and how we use as follows:\n\n * If you are a registered guest for ConnectOre Annual Summit 2021, any request for review, revise or correction of your personal data can be sent to john.fennell@copper.com.au specifying your request.\n\n#### Personal data about minors and children\n\nConnectOre does not knowingly collect data from or about children under 16 without the permission of parent(s)/guardian(s). If we learn that we have collected personal information from a child under 16, we will delete that information as quickly as possible. If you believe that we might have any information from or about a child under age 16, please contact us.\n\n#### How will you know if the Privacy Policy is changed?\n\nConnectOre may update its Privacy Policy from time to time. If we make any material changes you will be notified by means of a notice on our website prior on the date the change becomes effective. We encourage you to periodically review this page for the latest information on our privacy practices.\n\n## Technical And Regulatory Information\n\n#### Logging practices\n\nConnectOre automatically records the Internet Protocol (IP) addresses of visitors. The IP address is a unique number assigned to every computer on the internet. Generally, an IP address changes each time you connect to the internet (it is a \"dynamic\" address). Note, however, that if you have a broadband connection, depending on your individual circumstance, the IP address that we collect may contain information that could be deemed identifiable. This is because, with some broadband connections, your IP address doesn't change (it is \"static\") and could be associated with your personal computer.\n\nAs well as recording the IP addresses of users, ConnectOre may also keep track of sites that users visited immediately prior to visiting ConnectOre's website and the search terms they used to find it. We keep track of the pages visited on ConnectOre's website, the amount of time spent on those pages and the types of searches done on them. Your searches remain confidential and anonymous. ConnectOre uses this information only for statistical purposes to find out which pages users find most useful and to improve the website.\nConnectOre also captures and stores information that you transmit. This may include:\n\n * Browser/Device type/version\n * Operating system used\n * Media Access Control (MAC) address\n * Date and time of the server request\n * Volume of data transferred\n\n#### External links behaviour\n\nSome of the links on ConnectOre's websites link to other sites created and maintained by other public- and/or private-sector organizations. ConnectOre provides these links solely for your information and convenience. When you transfer to an outside website, you are leaving ConnectOre domain, and ConnectOre's information management policies no longer apply. ConnectOre encourages you to read the privacy statement of each external website that you visit before you provide any personal data.\n\n#### Cookies and web beacons\n\nCookies and web beacons are electronic placeholders that are placed on your device by websites to track your individual movements on that website over time. ConnectOre uses both session-based cookies (which last only for the duration of the user's session) and persistent cookies (which remain on your device and provide information about the session you are in and waits for the next time you use that site again).\n\nThese cookies and web beacons provide useful information to ConnectOre, enabling us to recognize repeat users, facilitate the user's access to and use of our sites, allows us to track usage behavior, and to balance the usage of our websites on all ConnectOre web servers.\nTracking cookies, third-party cookies, and other technologies such as web beacons may be used to process additional information, enable non-core functionalities on ConnectOre website and enable third-party functions (such as a social media \"share\" link). We may also include web beacons and other similar technology in promotional email messages to determine whether the messages have been opened.\n\n#### Do Not Track (DNT)\n\nThe online advertising industry has self-regulatory initiatives designed to provide consumers a choice in the types of ads they may see online and to conveniently opt-out from online behavioral ads served by some or all of the companies participating in these programs. Our websites do not respond to DNT consumer browser settings.\n\n#### Responses to legal requests\n\nConnectOre reserves the right to share your information to respond to duly authorized information requests of governmental authorities or where required by law.\n\n#### Your data rights\n\nConnectOre complies with all applicable data privacy laws and regulations including, but not limited to, the General Data Protection Regulation (GDPR) and the California Consumer Privacy Act (CCPA). Under these laws and regulations, you may have certain rights to your data. Should you wish to exercise any of these rights, please send an email request to john.fennell@copper.com.au with \"Data Privacy Request'' in the subject line and in the email please identify the specific privacy right you request assistance with. Please note additional information may be requested prior to fulfilling a request and that ConnectOre reserves the right to charge a fee, where permitted, to cover the cost of certain requests.\n\n#### How do I contact you if there is an issue?\nIf you have any questions or concerns about this Privacy Policy or about the use of your personal information, please feel free to contact us by email at john.fennell@copper.com.au"},"welcomeUrl":"https://connectore.org/app/welcome","welcomeTitle":"Welcome to ConnectOre and thanks for joining us! ","invitationAction":"join the ConnectOre community","setupCompletionMessage":null,"languages":[],"brandColors":[],"showLogin":true,"showShareMenu":null,"showFollowMenu":true,"showPlatformLogin":null,"showContactUs":null,"loginLabel":"Explorer Login","platformLoginLabel":"Community Platform","headerButtons":[]},"includeProfile":true,"disableProfileEditing":false,"dynamicEntityTypeNames":["Person","Organisation"],"profilePath":"/app/profile","welcomePath":"/app/welcome","id":"65d2edb6ebf7bb9388ffb014","slug":"wikiore-22-natural-deportment-characterisation","entityPath":"/appendices/wikiore-22-natural-deportment-characterisation","name":"Natural Deportment Characterisation","openGraph":{"title":null,"date":"2023-07-29T10:23:49.00","description":{"plain":"Introduction\nnatural deportment laboratory testing aims to determine if specific assay elements (as a proxy for mineralogy) are preferentially deporting by size. Typically expressed as a systematic increase in concentration in finer size fractions. \nassays from a series of size fractions for each sample are used to generate Response Curves. A mathematical function is then calculated across individual curves to generate a Response Ranking (RR) - a single number used to describe the magnitude of a Response Curve. Response Rankings are used as inputs into Grade Engineering block models, process simulations and economic evaluations. \nTesting can be carried out at drill core, blast hole chip or ROM scale although transforms are required to compare different scales. drill core testing is referred to as 'variability testing'. Testing of material at ROM scale is referred to as 'bulk testing', up to and including Production Trials. Depending on opportunity assessment requirements and site considerations a selection will be made regarding an appropriate sample type to test. \nTesting programs are conducted in two stages:\n\nAn initial evaluation phase to select size fractions that generate optimal mass distributions typically involving 5-6 size fractions, and\nRoutine testing based on a smaller number of size fractions (typically four) selected based on stage 1 mass results.\n\nvariability testing\nvariability testing can be carried out using coarse residues generated by crushing during routine laboratory assay preparation as a precursor to pulverisation. Many projects/sites routinely store coarse residues specifically for future testing or check assaying. In this case stored coarse residues can be used for cost effective testing. Stored pulps are not suitable for variability testing as material has undergone excessive breakage and natural deportment signatures have been lost. \ncrushing protocols for coarse residues vary between sites and companies. These residues are produced with the aim to reduce the top size of a particle size distribution to a statistically suitable point for accurately splitting a portion to be used for fine pulverising prior to chemical assaying. A typical top size for coarse residues is 99% passing -3.35mm or the equivalent #6 mesh (occasionally referred to as 80% passing 2mm). \nparticle size distributions are a function of crusher gap settings, drill core sizes and rock hardness. Crusher gap settings in particular can vary between laboratories or drift over time. Within limits this variability does not affect use of coarse residues for variability testing. However, it is necessary to establish actual particle size distributions for site specific coarse residues as part of an initial evaluation program in order to select optimal sieve sizes for routine testing. \nMass of specific sieve size fractions is also monitored during routine testing before samples are sent for assaying to provide a qa/qc flag for samples that show unusual mass distributions that may not be suitable for testing. sieve size selections primary objective is the generation of a minimum number of data points to define a statistically meaningful Response Curve and Ranking. This requires a minimum of three sieve sizes (generating four size fractions) across the cumulative mass range.\nSelection of Optimal Sieve Sizes\nsieve size selection aims to ensure roughly equal masses in each fraction. This provides sufficient coverage on a Response Curve diagram to generate statistical confidence in an eventual Response Ranking and subsequent modelling activities. Ideal mass in each fraction is calculated by 100%/'n' where 'n' is the number of sizes being generated by the testing. \nAs an example, if 5 sizes are planned then ideal mass per fraction is ~20%. Some variation around this is normal and expected however if masses deviate substantially from this as shown in the table below then selected size fractions should be adjusted.\nsize fraction #\nIdeal Mass\nFailed Mass qa/qc\nPassed Mass qa/qc\n1\n20%\n40%\n17%\n2\n20%\n10%\n23%\n3\n20%\n20%\n18%\n4\n20%\n5%\n19%\n5\n20%\n25%\n23%\nThere is no 'correct' set of sieve sizes or look up function for correct sizes, as long as mass distribution objectives are met then the selection is considered appropriate for those samples. It is recommended that for an initial evaluation (first 20-50 samples) five sieves are used (giving six fractions). This can be reduced to 3 sieves depending on Response Curve variability and consistency of mass fraction data.\nResponse Ranking (RR)\nCRC OREs Response Ranking approach allows results to be systematically and routinely processed and interpreted. This facilitates comparative ranking between deposits and domaining GE within deposits. RR is a mathematical function that can be used as an input into a range of CRC ORE modelling and simulation software environments to determine operational Grade Engineering scenarios and value utilising screening. Response Rankings are neither related or dependent on head grade, which acts as a modifying attribute. \nRR values are independent characteristics and, rather than providing an answer, allow for the calculation of a range of outcomes. They are the Grade Engineering equivalent of processing attributes (Bond work index, A*b,SPI etc...). Values by themselves do not indicate what mass pull gives optimum upgrade or what grade categories it should be applied to. These are dynamic operational decisions driven by RR but optimized by operational considerations and economics (more detail on this is available in ((STRATEGIC PLANNING WITH Grade Engineering|Chapter 8))). \nWhile this current section focuses on natural deportment, the same principles and ranking methodology can be applied to any separation lever as part of Grade Engineering assessments. Comparing RR values for a site against a global comparative database is a key aspect of Grade Engineering® opportunity assessments. Experience to date indicates when a site presents with RR >~60 at variability testing scale a high baseline opportunity generally exists. \nAlthough generating, processing and interpreting this data is relatively straightforward, systematic databases of grade by size data from drill core testing, production scale testing (e.g. belt cuts or trucks) or mill surveys, remains rare in the industry. This lack of data means that opportunities are typically overlooked on most operations stressing the importance of undertaking rapid assessment programs. CRC ORE continues to generate a significant centralized database of grade by size data across a range of deposit styles and sample types which can increasingly be used to rank and compare individual sites against a global dataset.\nresponse factors (RF)\nIn Grade Engineering, relative differences between separated fractions and feed grade is referred to as a response factor (RF). RF is a function of rock type and its interaction with separation lever technologies and can be calculated one of two ways:\n\nNew cumulative grade of undersize material / feed grade of sample\nRelative cumulative metal percent / relative cumulative mass percent\n\nAs both calculation methods normalise for starting grade/metal this allows for a standard graph to be produced to compare a set of results, irrespective of feed grade variations. \nresponse factor varies as a function of mass pull, with a small mass retained (10-30%) typically giving a high response factor while a high mass retained (>70%) gives a lower value. This co-dependency between response factor and mass is why CRC ORE identified a need for a standardised method to normalise responses. \nAn example of laboratory scale testing for response factors is shown below. Data points represent actual test laboratory results using crushed drill core at a range of screen sizes.\n \nresponse factors have two main properties useful for characterisation. Firstly, there is a maximum theoretical limit for any given mass pull as metal is constrained within the feed sample. This produces a limit of 100%/’m’ where ‘m’ is the cumulative undersize mass. The second useful property defines a no response result. Calculations for this mean that associated metal pulls will always be equal to mass pulls (40% mass = 40% metal, 90% mass = 90% metal etc…). Tabulated results below show both a maximum theoretical |LHS| and a no response |RHS| set of values included associated RF calculations.\nMass (%)\nMetal (%)\nRF\nMass (%)\nMetal (%)\nRF\n100\n100\n1.00\n100\n100\n1.00\n80\n100\n1.25\n80\n80\n1.00\n60\n100\n1.67\n60\n60\n1.00\n40\n100\n2.50\n40\n40\n1.00\n20\n100\n5.00\n20\n20\n1.00\nMaximum theoretical responses at a given mass pull can be expressed as RF = m -1, while the no response is expressed as RF = m. This provides a list of potential reference curves utilising the equation RF = m RS where RS is a response score between 0 and 1 (assuming upgrading into finer fractions). These curves, once converted to log/-log space, generate straight lines with their respective slope being defined by RS.\n \nScaling to Response Ranking\nRR values are calculated by the following equation:\n \nThey are generally scaled from 0-200 with 200 representing a theoretical maximum response. Negative values can be observed, indicating increasing concentration in coarse size fractions, however are not typical. Higher RR values indicate greater potential for separation from a feed material. \nRR values are calculated for each individual point within a given natural deportment sample. Resulting average values are then determined along with variations in associated Response Scores to provide a measure of fit to the expected trend. From the example below an average RR value of 68 is produced with an associated standard deviation in RS (StDev) of 0.03.\nSize\nMass (%)\nMetal (%)\nresponse factor (RF)\nResponse Score (RS)\nResponse Rank (RR)\n>50mm\n80\n86\n1.08\n0.32\n65\n50-19mm\n60\n70\n1.17\n0.30\n60\n19-9.5mm\n40\n55\n1.38\n0.35\n70\n<9.5mm\n20\n37\n1.85\n0.38\n76\n\nQA/QC Data Analysis\nqa/qc is a measure of curve fit to the mathematical model function which can be expressed as standard deviation against the Response Ranking. Curve shape and associated response attributes can be displayed using the grade by size Data Viewer. A snapshot of the user interface indicates the key functionalities. Any sample or element in the analytical suite can be selected for visualization. Examples of acceptable and non-acceptable qa/qc results are illustrated below. \nIt should be noted that other analytical elements (as proxies for mineralogy) can exhibit different Response Rankings as a function of different breakage and textural associations coupled with analytical precision. Intra-sample Response Ranking differences between elements become more pronounced when specific elements reflect increasingly diverse mineralogies. As an example Fe can be associated with a wide range of sulphides, oxides, silicates and carbonates. \nResponse Ranking standard deviations less than 0.05 (10RR units) are considered to be high quality; results between 0.05-0.10 (10-20RR units) are acceptable but are typically individually assessed; whereas values over 0.1 (20RR units) for drill core testing are regarded as failing qa/qc. standard deviation plus accurate sieve size selection ensures data points cover the full cumulative mass range and ensures down stream modelling activites are accurate. \nIn the example below the sample represented by the black line fails this qa/qc stage due to a significant deviation from the expected trend (this sample has a StDev of 0.18). Response Rankings that pass qa/qc are used for further analysis as well as to compare and bench mark responses for selected assay elements and associations.\n\nNegative RR Values\nAlthough typical RR values will range from 0 to 200 there is a subset that can present with negative values. Care is needed when dealing with these as, mathematically, they can technically range to negative infinity. It should be noted that an RR of -1200 is completely valid although highly skewed. Given qa/qc steps such values have increased thresholds to pass as they naturally produce high StDev values. Depending on the specific activity leaving negative results as they are may be valid however in cases such as averaging domains or spatial population they can present with challenges. \nTo resolve this issue true negative RR values can be calculated which aim to scale all negative results between -200 and 0. This process involves inverting the standard RR equation to calculate a relative upgrade for mass per metal and then taking this calculated value as the true negative result (equation shown below). An example comparison between the standard RR and true negative RR is highlighted in the following table.\n\nExample\nMass%\nMetal%\nRR\nStandard RR\n60%\n10%\n-702\nTrue Negative RR\n60%\n10%\n-156\nActivity 1: RR Calculation\nClick Here for a practical activity to calculate RR values from grade and mass data\nRR Analysis\nOnce results have been processed and samples put through qa/qc an initial analysis is conducted to determine any high level controls or links on RR. Note: graphs in the following section were generated using Reflex's ioGAS software however analysis can be conducted in any package. \nGenerally the first stage of any analysis is to evaluate each site domain to determine if a uniform response is present across the entire orebody or if specific rock types/domains respond differently. \n \nNext, relationships between each samples individual RRs should be evaluated to define any that present with offset deportment. Meaning as one element upgrades another doesn't, or does so at a different rate. For the Neytiri dataset as both Gold and Copper are present these can be compared. In a Grade Engineering study this should be done for all elements especially including any deleterious elements as this can impact on Grade Engineering application options. \n \nIn the above figure the 1:1 reference line shows where both elements show identical natural deportment behaviors. Results plotting above this line indicate that Cu is concentrating at a higher rate than Au and vice versa for results below the line. The coloured Response Ranking reference zones can be used to compare and bench mark responses. Based on extensive CRC ORE testing and Grade Engineering assessments across a range of deposits and deposit types, Response Rankings above 60 for variability testing are considered to show potential for natural deportment as a dominant Grade Engineering value driver. Response Rankings of 20-60 are considered to indicate that integration of natural deportment with an additional lever such as differential blasting will be required to deliver value. Response Rankings below 20 are considered to indicate that natural deportment will not be a significant driver. Negative RR values indicate an inversed relationship than expected between size and grade and need to be treated separately. \nAny relationships found at this stage of analysis that can discriminate samples falling into these bins should be noted as it will aid in spatial population and downstream predictions. \nThis analysis method is useful for tracking mineralogical signatures of natural deportment. For example, if significant amounts of pyrite were preferentially deporting by size compared to initial mineralogy of the head sample, it would be expected that the Response Ranking S:Cu ratio would increase. Conversely if high Cu-sulphide phases such as bornite or chalcocite were preferentially deporting then the Response Ranking S:Cu ratio would decrease. \nIn the extensive data sets developed in CRC ORE projects to-date, no relationship between head grade and RR has been observed. This reflects the dominant control between association and paragenesis rather than abundance. Although no strong link between head grade and RR has been observed if such a link is ever found at a particular site it will have a profound impact on down streamGE processes. \nWork is ongoing to determine fundamental geological controls on variable natural deportment responses to develop predictive models. \nDiversity of geological control is reflected in significant variability of Response Ranking evident for typical testing programs. It is recommended that for initial assessment of grade by size typically developed using drill core residues; composite sample intervals similar to metallurgical composites or nominal bench height are used. As an initial assessment a sample selection matrix of different ore types/lithologies, alteration styles and grade classes should be developed until more coherent RR groupings are recognized as discrete domains. This typically involves a minimum of 100 samples to adequately cover a sample selection matrix. As for any geometallurgical style attribute or domaining exercise an extensive sampling and testing program eventually involving thousands of samples, may be required to support domaining in situations of high variability. As the database grows assignment of average RR by geological category is generally undertaken. \nFor extensive multi-element data RR’s for individual elements can be comparatively ranked to highlight associations which typically provide information on probable controls. In the case of the mesothermal gold example a very strong correlation between high RR for Au, Bi, Ag and S is evident. In the case of the porphyry Cu example Mo shows high RR while Cu, Zn, Ag, S, Pb and Cu show a closeting of moderate RR. This may indicate that the moderate Cu RR response is related to late stage base metal-bearing veins rather than earlier paragenetic Cu associations in veins or disseminations which are not reporting as preferential grade by size related breakage. \nThe Response Ranking approach developed by CRC ORE allows grade by size data to be systematically and routinely processed and interpreted for qa/qc. This facilitates comparative ranking between deposits and definition of variability and domaining within deposits. Comparative ranking is particularly suited for testing of coarse assay residues where the residues have been generated using a constrained sample preparation and size reduction approach. \nAlthough generating grade by size data and more recently processing and interpreting this data is relatively straightforward, systematic databases of grade by size data from drill core testing, production scale testing (e.g. belt cuts or trucks) or mill surveys, remains rare in the industry. This lack of data means that grade by size opportunity is typically overlooked on most operations stressing the importance of undertaking rapid assessment programs. CRC ORE continues to generate a significant centralized database of grade by size data across a range of deposit styles and sample types which can increasingly be used to rank and compare individual sites against a global dataset. Response Rankings above 60 for drill core scale testing indicate potential for grade by size to be considered as a dominant Grade Engineering value driver. \nResponse Rankings are mathematical functions that can be used as inputs into a range of CRC ORE modelling and simulation software to determine operational Grade Engineering scenarios and value. Response Rankings are not related to or dependent on head grade, which acts as a modifying attribute. The higher the RR the higher the potential to use grade by size and resulting screening to separate new accept and reject type #feed streams. RR by itself does not indicate what mass pull gives optimum upgrade or what grade categories it should be applied to. These are dynamic operational decisions driven by RR but optimized by operational considerations and economics.\nDownload the RR data used in this analysis Neytiri RR data\nWorkflow for Natural Deportment Characterisation\n \nDomaining Variability Responses\nOnce analysis has been completed this information passed on for population into the Grade Engineering block model. More detail on specific methodologies used for this can be found here.\nProduction Scale-Up\nPrevious CRC ORE studies have observed a relatively consistent increase in Response Rankings when moving from drill core variability testing scale to production scale. This difference is usually accounted for in what is referred to as a “scale-up Factor”. This is applied across all drill core test results to bring them into line with expected production scale responses. Studies to date have found two common scale-up Factors; the first at approximately x1.20 and a second at x1.60. This has been observed to vary both across and within a given site. \nCRC ORE has observed only a single case where production scale responses were lower than those measured at drill core scale (scale-up Factor = x0.50).\nExample of normal scale-up relationship between drill core (red) and bulk samples (blue).\n \nBulk testing\nbulk testing is critical in determining both production scale responses and associated scale-up factors for drill core results. Ideally ROM or post primary crusher material should be sampled and evaluated using the exact same protocols as variability testing to determine; ideal sizes, grades, response factors and Response Rankings. \nMore detail on how to effectively sample bulk material is found here.\nProduction Trials\nDetails on conducting Production Trials can be found here: [Site Trials](https://wikiore.com.au/Site Trials)\n\n\nPrevious Section: Methods | ((Induced deportment Characterisation|Next Section: Induced deportment Characterisation))\n"},"image":null},"entityTypeName":"Page","updated":"2023-07-29T10:23:49.00","__type":"Page"}},
"staticQueryHashes": ["1044227382","1158597448","1242646999","1427075558","1452322194","1520036161","1545705019","1586309863","1606754935","1816168740","1864381666","1903214493","1945056504","1989845544","2034981229","2181044613","2409034939","2463401854","2526615987","2642656775","2862279633","2867243664","2910164142","2912920178","296816903","3073584486","3150399266","3172506128","3320076387","3447680494","3453148481","3624873332","364221563","3692255024","3778988535","3782604890","4091857177","4216505212","591477963","701411134","758936535","80004486","857137463","881103158"]}