
Induced Deportment Characterisation
Induced Deportment Characterisation
Induced Deportment Characterisation
Induced Deportment Characterisation
Introduction
blast fragmentation models are typically used to optimise the run of mine (ROM) [particle size](https://en.wikipedia.org/wiki/Particle_size) distribution (PSD) with respect to concentrator productivity (i.e. throughput ), and to a lesser extent for reducing oversize and increasing load and haul productivity.For Grade Engineering™, where the mass pull governs upgrade potential for a domain or rock type, understanding and controlling PSD is crucial in ensuring metal deports as expected to the screen undersize.
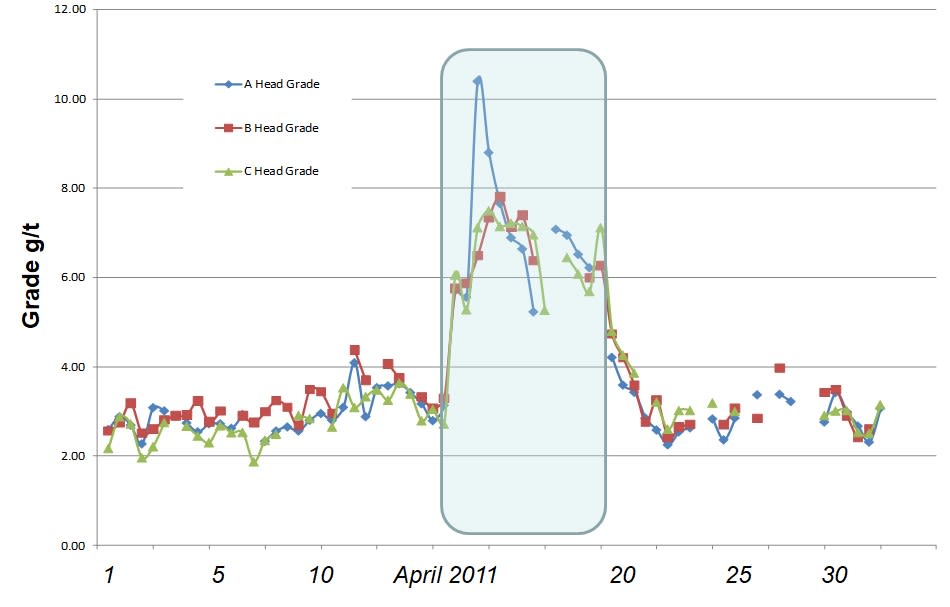
blast fragmentation modelling has applications in both Natural and [Induced deportment](/pages/wikiore-induced-deportment) [Grade Engineering](/pages/wikiore-introduction-to-grade-engineering) scenarios. For [natural deportment](/pages/wikiore-natural-deportment), fragmentation modelling can be used to modify blast designs to meet a mass pull requirement for a given screen aperture. In addition, a well calibrated fragmentation model can be used to conduct sensitivity studies to determine the impact that spatially varying rock mass characteristics can have on PSD, and hence expected upgrade for a given screen size.When the response of the rock mass is not strong enough to economically upgrade all ores, deportment can be induced via differential blasting, where each blast hole is charged according to a local grade. That is, high grade regions within the blast block are subjected to high energy, and low-grade regions to low energy. This charging strategy attempts to create a bimodal ROM size distribution which can be separated using screening to create a fine, high grade accept stream and coarse, low grade reject stream. This was presented by Bye in 2011. In this example, differentially blasted ore was screened and fed to the concentrator. feed grade assays showed a marked and unmistakable upgrade during the period when the differentially blasted ore was fed to the concentrator.
A perfectly bimodal distribution of fragmentation is the Holy Grail for differential blasting. However, due to the difficulty in segregating blast energy between neighbouring holes, this is unlikely to be met using current blasting techniques.
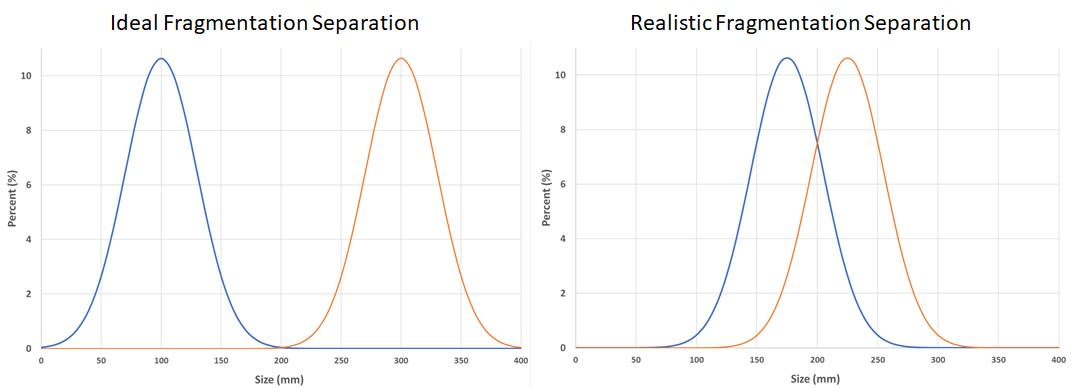
Nonetheless, the shortcomings of the inefficiency of separation between high and low energy blast holes depend on the bench scale heterogeneity across a blast block, and hence the proportion of low and high-grade holes in proximity to one another. If there are clusters of holes that can be blasted in a similar fashion, these inefficiencies can be minimised, and value found using this Grade Engineering™ lever.
For differential blasting, fragmentation modelling is critical in determining potential size distributions that can be achieved given rock mass characteristics such as strength and structure, site constraints such as explosive type availability, and equipment limitations which may limit blast hole diameter, and burden and spacing of a blast pattern.
Blast Modelling Method
Generally, fragmentation models can be grouped into empirical and mechanistic categories. Empirical models include the common Kuz-Ram model variants and can be easily implemented in a spreadsheet. Mechanistic models are usually developed by research organisations or explosive companies, requiring significant computing power to deal with the complexities of the explosive detonation processes and rock mass descriptors. Each approach has advantages and disadvantages.
CRC ORE uses the so-called Crushed Zone Model (CZM) which incorporates a mechanistic model of the fines generated around the blast hole (i.e. the crushed zone) with the empirical Kuz-Ram empirical model (reference) to describe the coarse end of the size distribution.
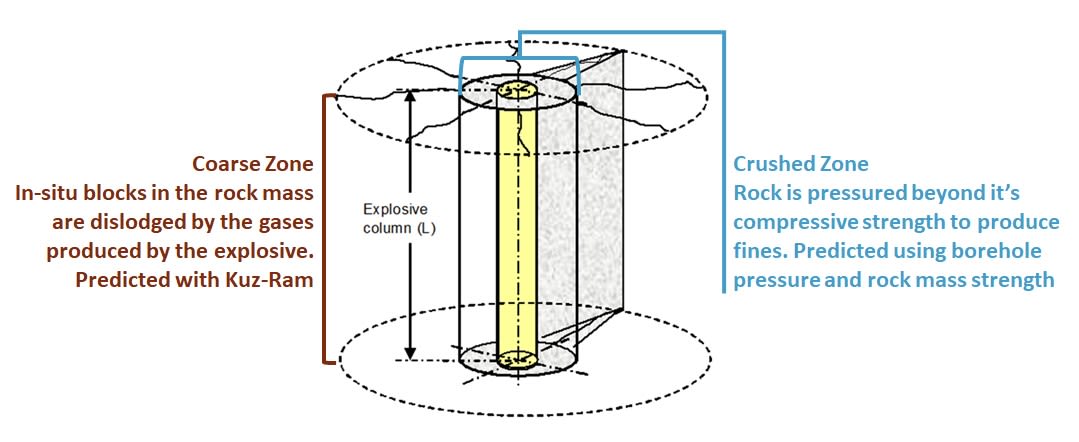
A significant advantage of this model is that it has been implemented within the IES framework, allowing full access to its mass simulation and sensitivity analysis capabilities.
Input Data Requirements
Data needed to develop a fit for purpose model fragmentation can be broken down into three categories; the blast design, explosive description, and geotechnical characteristics of the rock mass. These are described in some detail below.
Blast Design
The blast design captures how the explosive energy is distributed through the bench and is defined by the parameters described in Table 1.
| Parameter | Description |
|---|---|
| bench Height (m) | Height of the bench |
| Burden (m) | Distance between rows of holes |
| Spacing (m) | Distance between holes in each row |
| Sub-drill (m) | Distance blast hole penetrates into the bench below |
| Hole diameter (mm) | blast hole diameter |
Explosive Characteristics
The CZM allows for two decks to be applied per hole, nominally designated toe and collar charges. Where possible, the explosive characteristics should be measured, in particular, the in-hole velocity of detonation (VOD). The bore hole pressure is proportional to the square of the VOD, which has a significant impact on the volume of fines generated around the blast hole, and hence the fine end of the particle size distribution.
| Parameter | Description |
|---|---|
| Explosive Type | Name (for reference) |
| Charge Length (m) | Length of charge in hole |
| Charge Mass (kg) | Mass of charge in hole |
| Explosive Density (kg/m³) | Final explosive density |
| VOD (m/s) | Steady state velocity of detonation |
| Relative Weight Strength | Compared to ANFO |
Rock Mass
The most important rock mass descriptors are its strength and structure. Density and elasticity of the rock also affect model outcomes to a lesser extent.
| Parameter | Description |
|---|---|
| UCS (MPa) | Uniaxial Compressive Strength |
| E (GPa) | Young’s Modulus of Elasticity |
| Rock Density (kg/m³) | Density of the Rock Mass |
| In-situ block size (ISB) (m) | Mean In-situ block size |
| fines top size (mm) | The top size of the fines in the crushed zone |
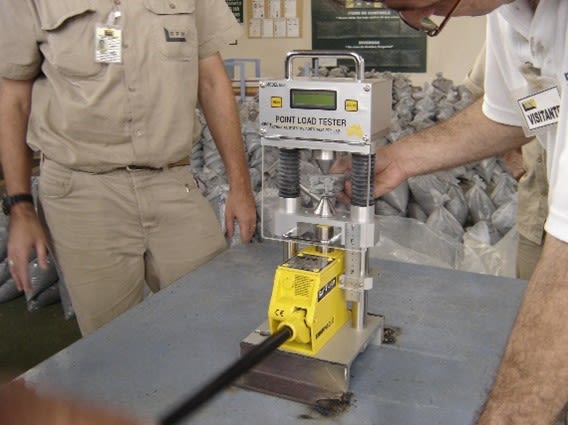
In most cases UCS and ISB will be determined from proxies. The Point Load Index test is a relatively simple way to obtain a proxy for UCS, and as the tester is portable, it can be taken to site and used to gather a statistically representative number of measurements.
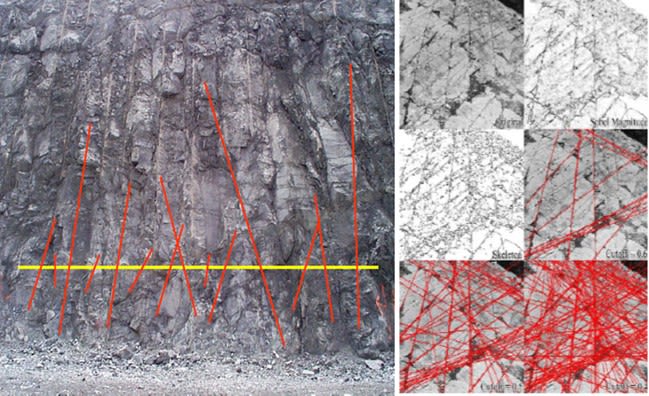
The most widely reported geotechnical parameter that relates to rock mass structure across an orebody is the Rockmass Quality Designation (RQD) (Deere and Deere, 1988). This is measured from drill core and is simply the percentage of core longer than 100 mm for a given run of drill core. Calculation of RQD using the equation form of:

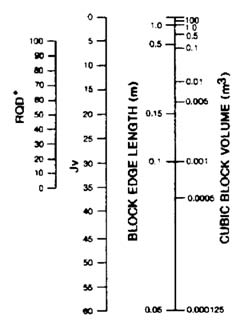
While it is not a precise measurement, especially as it is affected by drill core orientation to the direction of rock mass structures, it does allow for wide spatial coverage of the rock mass due to its simplicity. Conversion from RQD to IBS varies from scenario to scenario, but CRC ORE tends to use the relationship described by Palmstrom (1982) as shown graphically in Figure 5.
Ideally, a block model that has been populated from dense measurements would be available for blast fragmentation modelling across an orebody. This tends to be rare, so it is more common to perform fragmentation modelling on a domain basis, that is, assigning geotechnical parameters to each lithology in the ore body.
Data Entry and Model Simulations
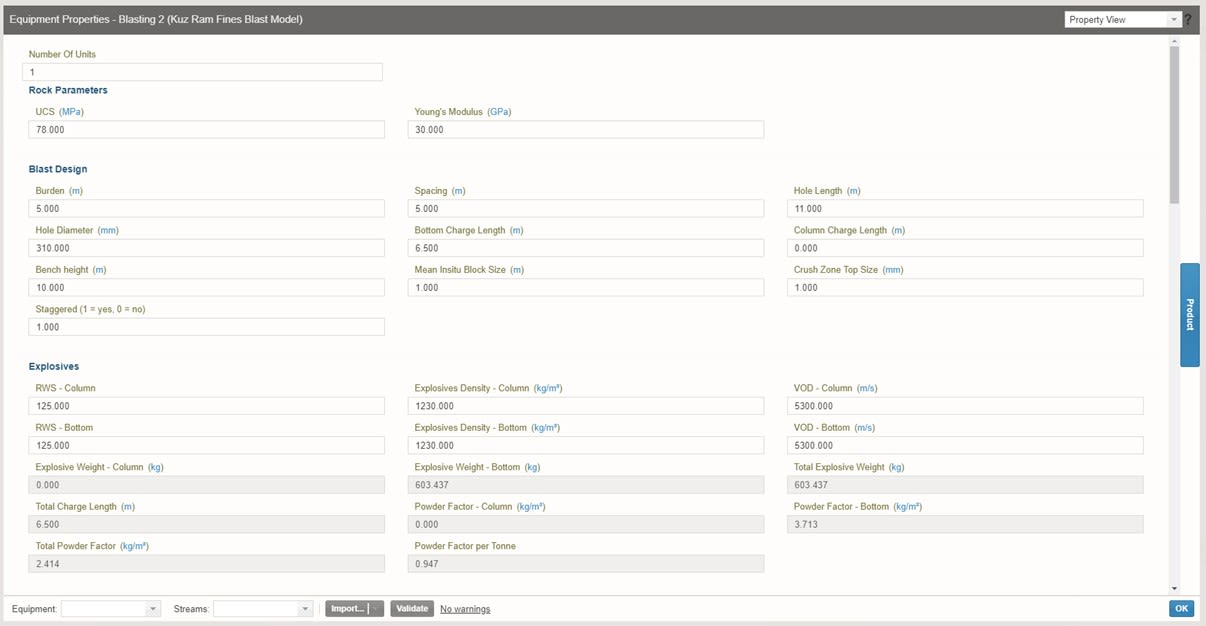
Once the blast design, and explosive and rock mass characteristics have been collated, these can be entered into the IES interface.
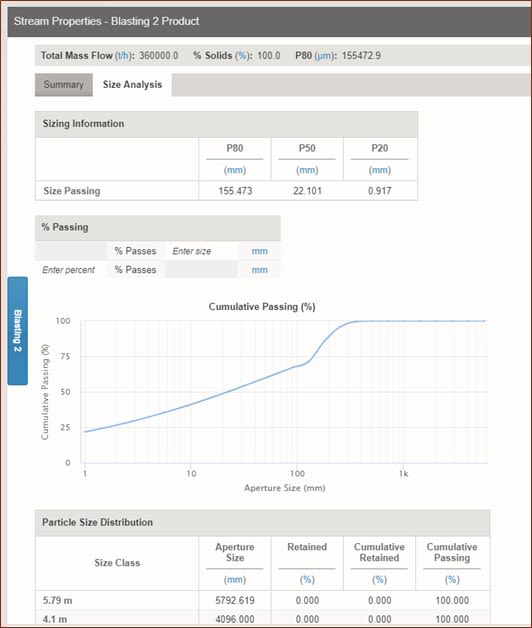
Once the model has been simulated the results will be available as stream properties of the BFM. These can then be imported into Excel for further analysis.
Calibration Process
Regardless of whether a fragmentation model is calibrated or not, it will nonetheless generate results which will appear to be sensible. For this reason, it is critical that field measurements are taken to allow model input variables to be fine-tuned to ensure that the best possible results are obtained from the model simulations.
Full scale ROM particle size distributions are impractical to determine manually (i.e. by sieving) and the widely accepted means for measuring PSD is to use image analysis techniques on images captured at the muckpile or dump pocket. While image analysis techniques have accuracy limitations, especially at the finer end of the PSD, they allow for numerous measurements to be made throughout a blast block, giving some statistical robustness to the model outputs.
To deal with limitations at the fine end, it is good practice to conduct a belt cut from the primary crusher that has been fed from the blast in question in order to get some indication of the proportion of fines. These results can then be used to calibrate the fine end of the PSD.
With regards to which ‘knobs’ are available to adjust in the model outcomes; the CZM does not have any fudge factors per se. All that can be adjusted are input parameters where there are uncertainties around their absolute value, for example, the reported VOD of a particular explosive may be an idealised case, or the UCS obtained from a block model populated with sparse measurements.
The following table details what can be adjusted, and their effect on the resultant particle sizedistribution.
| Parameter | PSD Effects |
|---|---|
| UCS | Lower UCS will increase fines in PSD |
| Explosive VOD | Higher VOD will increase fines in PSD |
| In-situ block size | Affects the coarse end of the PSD |
| fines top size | Smaller top size increases fines in PSD |
Ideally, the model should be implemented stochastically, i.e. where input parameters are defined by a mean and standard deviation, and then a Monte Carlo simulation carried out to generate a PSD envelope of results. While the IES framework does not allow this, the user could run a sensitivity analysis were the various parameters are flexed. Alternatively, a mass simulation could be run using a spreadsheet populated with stochastically generated parameters.
Limitations
Assuming modelled results reasonably reflect measured PSDs, it can then be used to vary blast designs to maximise Grade Engineering potential. There are a number of factors that will limit the extents to which the PSD can be adjusted.
Drilling Equipment
Available site drill fleets dictate drill hole diameters, as well as the minimum burden and spacing of any changed patterns.
Water
If water is present in holes, this limits potential explosives that can be utilised to only waterproof products. These are generally higher energy and especially for differential blasting applications will constrain the difference between high and low energy particle size distributions.
Explosive Types
Much along the same lines, if site only has a low energy explosive available (say ANFO) this constrains the maximum energy that can be loaded into a hole, reducing the potential difference between high and low grade holes.
Diggability & Equipment Productivity
differential blasting aims to produce fine, high grade material and coarse, low grade material. While fine ROM enhances equipment productivity and concentratorthroughput, coarseROM can have a negative impact upon diggability and loading rates. This must be taken into account when designing the low energy blast hole s.
Rock Mass Characteristics
Some orebodies are already too fractured and/or soft to control blast fragmentation to any great extent. In this case, potential Induced deportment due to differential blasting may be evaluated as inappropriate for the site.

