
Natural Deportment Characterisation
Natural Deportment Characterisation
Natural Deportment Characterisation
Natural Deportment Characterisation
Introduction
natural deportment laboratory testing aims to determine if specific assay elements (as a proxy for mineralogy) are preferentially deporting by size. Typically expressed as a systematic increase in concentration in finer size fractions.
assays from a series of size fractions for each sample are used to generate Response Curves. A mathematical function is then calculated across individual curves to generate a Response Ranking (RR) - a single number used to describe the magnitude of a Response Curve. Response Rankings are used as inputs into Grade Engineering block models, process simulations and economic evaluations.
Testing can be carried out at drill core, blast hole chip or ROM scale although transforms are required to compare different scales. drill core testing is referred to as 'variability testing'. Testing of material at ROM scale is referred to as 'bulk testing', up to and including Production Trials. Depending on opportunity assessment requirements and site considerations a selection will be made regarding an appropriate sample type to test.
Testing programs are conducted in two stages:
- An initial evaluation phase to select size fractions that generate optimal mass distributions typically involving 5-6 size fractions, and
- Routine testing based on a smaller number of size fractions (typically four) selected based on stage 1 mass results.
variability testing
variability testing can be carried out using coarse residues generated by crushing during routine laboratory assay preparation as a precursor to pulverisation. Many projects/sites routinely store coarse residues specifically for future testing or check assaying. In this case stored coarse residues can be used for cost effective testing. Stored pulps are not suitable for variability testing as material has undergone excessive breakage and natural deportment signatures have been lost.
crushing protocols for coarse residues vary between sites and companies. These residues are produced with the aim to reduce the top size of a particle size distribution to a statistically suitable point for accurately splitting a portion to be used for fine pulverising prior to chemical assaying. A typical top size for coarse residues is 99% passing -3.35mm or the equivalent #6 mesh (occasionally referred to as 80% passing 2mm).
particle size distributions are a function of crusher gap settings, drill core sizes and rock hardness. Crusher gap settings in particular can vary between laboratories or drift over time. Within limits this variability does not affect use of coarse residues for variability testing. However, it is necessary to establish actual particle size distributions for site specific coarse residues as part of an initial evaluation program in order to select optimal sieve sizes for routine testing.
Mass of specific sieve size fractions is also monitored during routine testing before samples are sent for assaying to provide a qa/qc flag for samples that show unusual mass distributions that may not be suitable for testing. sieve size selections primary objective is the generation of a minimum number of data points to define a statistically meaningful Response Curve and Ranking. This requires a minimum of three sieve sizes (generating four size fractions) across the cumulative mass range.
Selection of Optimal Sieve Sizes
sieve size selection aims to ensure roughly equal masses in each fraction. This provides sufficient coverage on a Response Curve diagram to generate statistical confidence in an eventual [Response Ranking](/sub-topics/natural-deportment-characterisation) and subsequent modelling activities. Ideal mass in each fraction is calculated by 100%/'n' where 'n' is the number of sizes being generated by the testing.As an example, if 5 sizes are planned then ideal mass per fraction is ~20%. Some variation around this is normal and expected however if masses deviate substantially from this as shown in the table below then selected size fractions should be adjusted.
size fraction #Ideal Mass
Failed Mass qa/qc
Passed Mass qa/qc
1
20%
40%
17%
2
20%
10%
23%
3
20%
20%
18%
4
20%
5%
19%
5
20%
25%
23%
There is no 'correct' set of sieve sizes or look up function for correct sizes, as long as mass distribution objectives are met then the selection is considered appropriate for those samples. It is recommended that for an initial evaluation (first 20-50 samples) five sieves are used (giving six fractions). This can be reduced to 3 sieves depending on Response Curve variability and consistency of mass fraction data.
Response Ranking (RR)
CRC OREs Response Ranking approach allows results to be systematically and routinely processed and interpreted. This facilitates comparative ranking between deposits and domaining GE within deposits. RR is a mathematical function that can be used as an input into a range of CRC ORE modelling and simulation software environments to determine operational Grade Engineering scenarios and value utilising screening. Response Rankings are neither related or dependent on head grade, which acts as a modifying attribute.
RR values are independent characteristics and, rather than providing an answer, allow for the calculation of a range of outcomes. They are the Grade Engineering equivalent of processing attributes (Bond work index, A*b,SPI etc...). Values by themselves do not indicate what mass pull gives optimum upgrade or what grade categories it should be applied to. These are dynamic operational decisions driven by RR but optimized by operational considerations and economics (more detail on this is available in ((STRATEGIC PLANNING WITH Grade Engineering|Chapter 8))).
While this current section focuses on natural deportment, the same principles and ranking methodology can be applied to any separation lever as part of Grade Engineering assessments. Comparing RR values for a site against a global comparative database is a key aspect of Grade Engineering® opportunity assessments. Experience to date indicates when a site presents with RR >~60 at variability testing scale a high baseline opportunity generally exists.
Although generating, processing and interpreting this data is relatively straightforward, systematic databases of grade by size data from drill core testing, production scale testing (e.g. belt cuts or trucks) or mill surveys, remains rare in the industry. This lack of data means that opportunities are typically overlooked on most operations stressing the importance of undertaking rapid assessment programs. CRC ORE continues to generate a significant centralized database of grade by size data across a range of deposit styles and sample types which can increasingly be used to rank and compare individual sites against a global dataset.
response factors (RF)
In Grade Engineering, relative differences between separated fractions and feed grade is referred to as a response factor (RF). RF is a function of rock type and its interaction with separation lever technologies and can be calculated one of two ways:
- New cumulative grade of undersize material / feed grade of sample
- Relative cumulative metal percent / relative cumulative mass percent
As both calculation methods normalise for starting grade/metal this allows for a standard graph to be produced to compare a set of results, irrespective of feed grade variations.
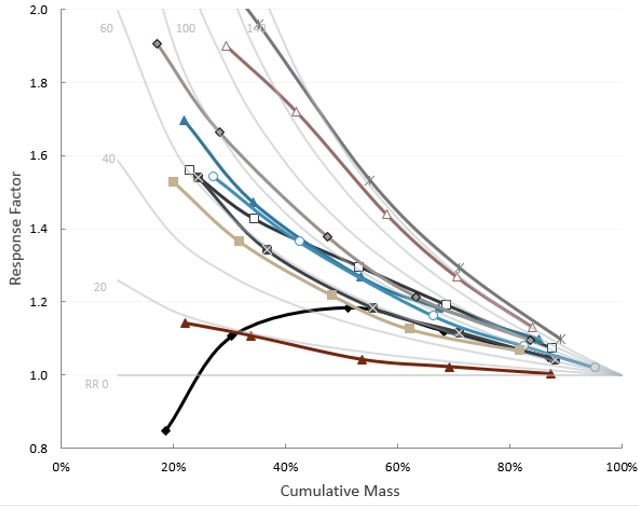
response factor varies as a function of mass pull, with a small mass retained (10-30%) typically giving a high response factor while a high mass retained (>70%) gives a lower value. This co-dependency between response factor and mass is why CRC ORE identified a need for a standardised method to normalise responses.
An example of laboratory scale testing for response factors is shown below. Data points represent actual test laboratory results using crushed drill core at a range of screen sizes.
response factors have two main properties useful for characterisation. Firstly, there is a maximum theoretical limit for any given mass pull as metal is constrained within the feed sample. This produces a limit of 100%/’m’ where ‘m’ is the cumulative undersize mass. The second useful property defines a no response result. Calculations for this mean that associated metal pulls will always be equal to mass pulls (40% mass = 40% metal, 90% mass = 90% metal etc…). Tabulated results below show both a maximum theoretical |LHS| and a no response |RHS| set of values included associated RF calculations.
Mass (%)
Metal (%)
RF
Mass (%)
Metal (%)
RF
100
100
1.00
100
100
1.00
80
100
1.25
80
80
1.00
60
100
1.67
60
60
1.00
40
100
2.50
40
40
1.00
20
100
5.00
20
20
1.00
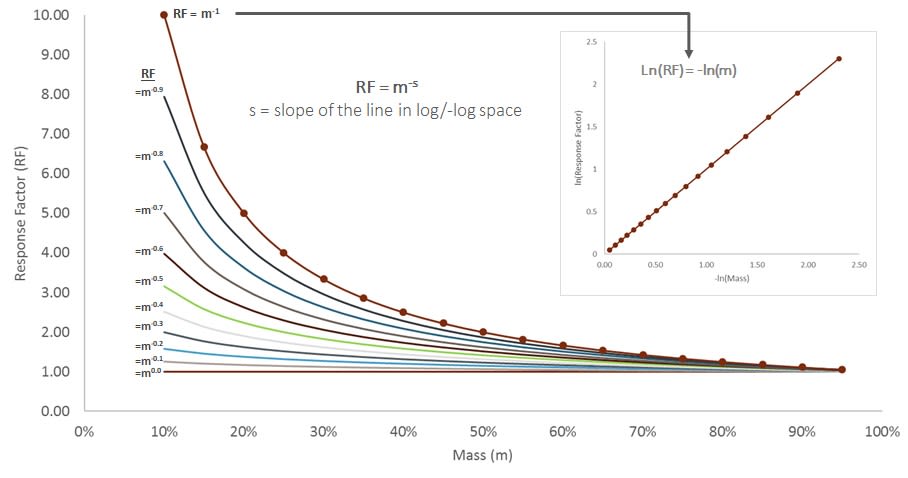
Maximum theoretical responses at a given mass pull can be expressed as RF = m -1, while the no response is expressed as RF = m. This provides a list of potential reference curves utilising the equation RF = m RS where RS is a response score between 0 and 1 (assuming upgrading into finer fractions). These curves, once converted to log/-log space, generate straight lines with their respective slope being defined by RS.
Scaling to Response Ranking
RR values are calculated by the following equation:

They are generally scaled from 0-200 with 200 representing a theoretical maximum response. Negative values can be observed, indicating increasing concentration in coarsesize fractions, however are not typical. Higher RR values indicate greater potential for separation from a feed material.
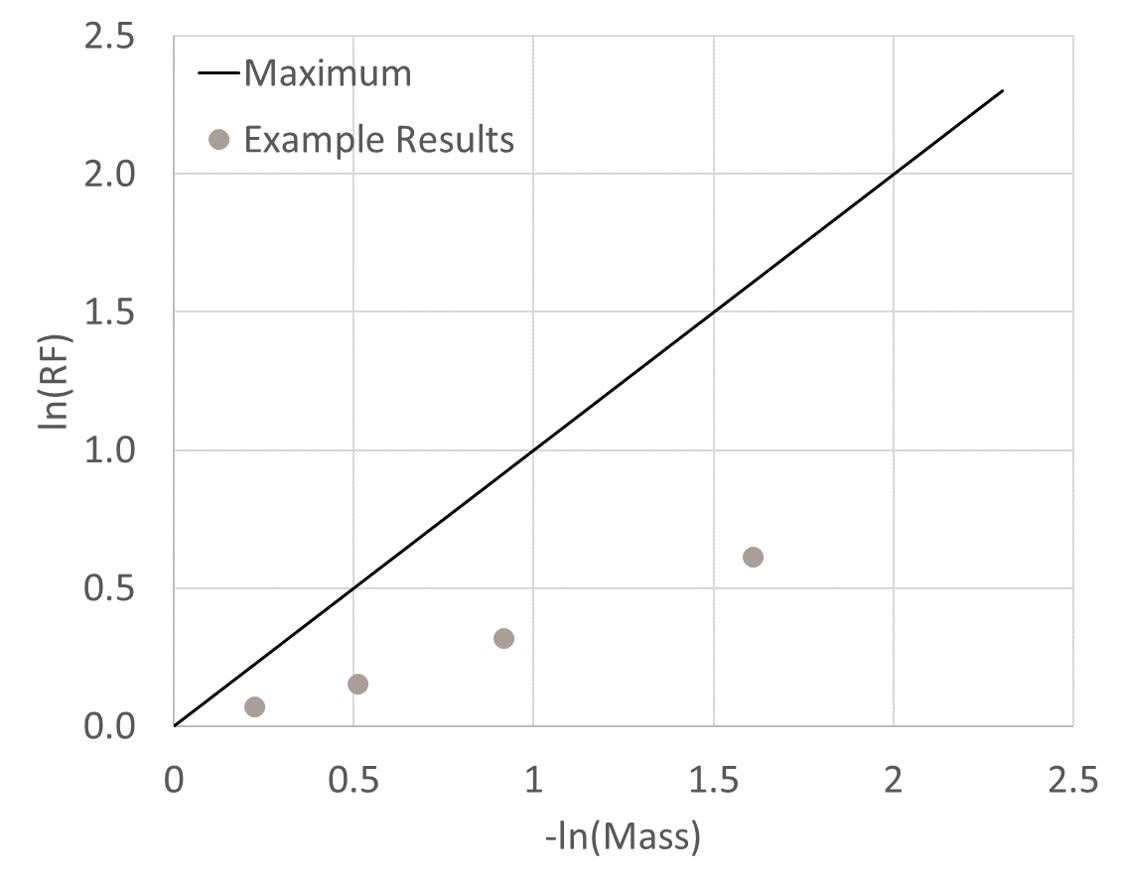
RR values are calculated for each individual point within a given natural deportment sample. Resulting average values are then determined along with variations in associated Response Scores to provide a measure of fit to the expected trend. From the example below an average RR value of 68 is produced with an associated standard deviation in RS (StDev) of 0.03.
Size
Mass (%)
Metal (%)
response factor (RF)
Response Score (RS)
Response Rank (RR)
50mm
80
86
1.08
0.32
65
50-19mm
60
70
1.17
0.30
60
19-9.5mm
40
55
1.38
0.35
70
<9.5mm
20
37
1.85
0.38
76
QA/QC Data Analysis
qa/qc is a measure of curve fit to the mathematical model function which can be expressed as [standard deviation](https://en.wikipedia.org/wiki/Standard_deviation) against the [Response Ranking](/sub-topics/natural-deportment-characterisation). Curve shape and associated response attributes can be displayed using the [grade by size](/pages/wikiore-natural-deportment) Data Viewer. A snapshot of the user interface indicates the key functionalities. Any sample or element in the analytical suite can be selected for visualization. Examples of acceptable and non-acceptable qa/qc results are illustrated below.It should be noted that other analytical elements (as proxies for mineralogy) can exhibit different Response Rankings as a function of different breakage and textural associations coupled with analytical precision. Intra-sample Response Ranking differences between elements become more pronounced when specific elements reflect increasingly diverse mineralogies. As an example Fe can be associated with a wide range of sulphides, oxides, silicates and carbonates.
Response Ranking standard deviations less than 0.05 (10RR units) are considered to be high quality; results between 0.05-0.10 (10-20RR units) are acceptable but are typically individually assessed; whereas values over 0.1 (20RR units) for drill core testing are regarded as failing qa/qc. standard deviation plus accurate sieve size selection ensures data points cover the full cumulative mass range and ensures down stream modelling activites are accurate.
In the example below the sample represented by the black line fails this qa/qc stage due to a significant deviation from the expected trend (this sample has a StDev of 0.18). Response Rankings that pass qa/qc are used for further analysis as well as to compare and bench mark responses for selected assay elements and associations.
Negative RR Values
Although typical RR values will range from 0 to 200 there is a subset that can present with negative values. Care is needed when dealing with these as, mathematically, they can technically range to negative infinity. It should be noted that an RR of -1200 is completely valid although highly skewed. Given qa/qc steps such values have increased thresholds to pass as they naturally produce high StDev values. Depending on the specific activity leaving negative results as they are may be valid however in cases such as averaging domains or spatial population they can present with challenges.
To resolve this issue true negative RR values can be calculated which aim to scale all negative results between -200 and 0. This process involves inverting the standard RR equation to calculate a relative upgrade for mass per metal and then taking this calculated value as the true negative result (equation shown below). An example comparison between the standard RR and true negative RR is highlighted in the following table.

Example
Mass%
Metal%
RR
Standard RR
60%
10%
-702
True Negative RR
60%
10%
-156
Activity 1: RR Calculation
Click Here for a practical activity to calculate RR values from grade and mass data
RR Analysis
Once results have been processed and samples put through qa/qc an initial analysis is conducted to determine any high level controls or links on RR. Note: graphs in the following section were generated using Reflex's ioGAS software however analysis can be conducted in any package.
Generally the first stage of any analysis is to evaluate each site domain to determine if a uniform response is present across the entire orebody or if specific rock types/domains respond differently.
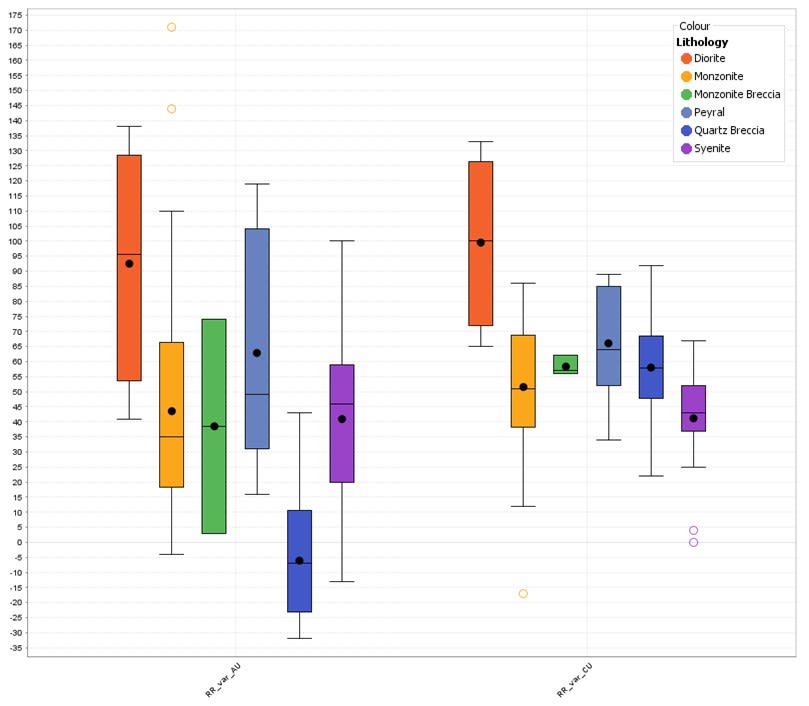
Next, relationships between each samples individual RRs should be evaluated to define any that present with offset deportment. Meaning as one element upgrades another doesn't, or does so at a different rate. For the Neytiri dataset as both Gold and Copper are present these can be compared. In a Grade Engineering study this should be done for all elements especially including any deleterious elements as this can impact on Grade Engineering application options.
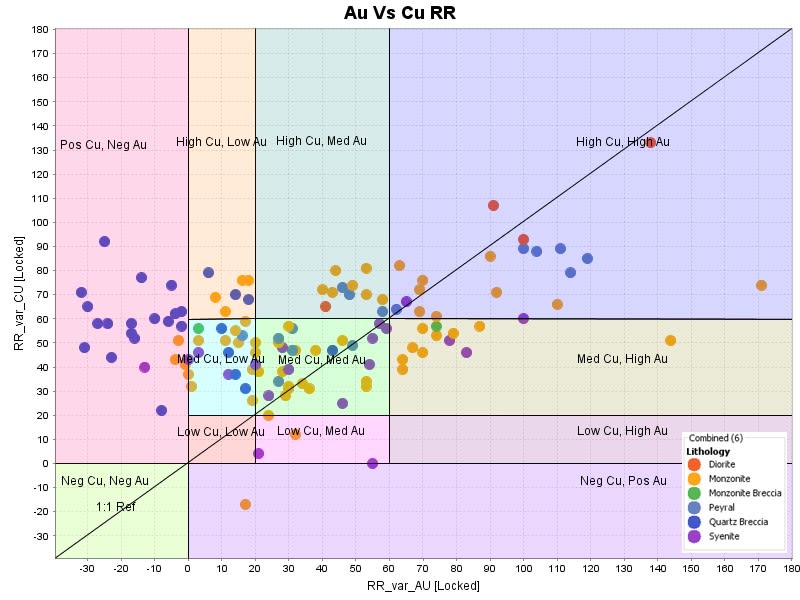
In the above figure the 1:1 reference line shows where both elements show identical natural deportment behaviors. Results plotting above this line indicate that Cu is concentrating at a higher rate than Au and vice versa for results below the line. The coloured Response Ranking reference zones can be used to compare and bench mark responses. Based on extensive CRC ORE testing and Grade Engineering assessments across a range of deposits and deposit types, Response Rankings above 60 for variability testing are considered to show potential for natural deportment as a dominant Grade Engineering value driver. Response Rankings of 20-60 are considered to indicate that integration of natural deportment with an additional lever such as differential blasting will be required to deliver value. Response Rankings below 20 are considered to indicate that natural deportment will not be a significant driver. Negative RR values indicate an inversed relationship than expected between size and grade and need to be treated separately.
Any relationships found at this stage of analysis that can discriminate samples falling into these bins should be noted as it will aid in spatial population and downstream predictions.
This analysis method is useful for tracking mineralogical signatures of natural deportment. For example, if significant amounts of pyrite were preferentially deporting by size compared to initial mineralogy of the head sample, it would be expected that the Response Ranking S:Cu ratio would increase. Conversely if high Cu-sulphide phases such as bornite or chalcocite were preferentially deporting then the Response Ranking S:Cu ratio would decrease.
In the extensive data sets developed in CRC ORE projects to-date, no relationship between head grade and RR has been observed. This reflects the dominant control between association and paragenesis rather than abundance. Although no strong link between head grade and RR has been observed if such a link is ever found at a particular site it will have a profound impact on down streamGE processes.
Work is ongoing to determine fundamental geological controls on variable natural deportment responses to develop predictive models.
Diversity of geological control is reflected in significant variability of Response Ranking evident for typical testing programs. It is recommended that for initial assessment of grade by size typically developed using drill core residues; composite sample intervals similar to metallurgical composites or nominal bench height are used. As an initial assessment a sample selection matrix of different ore types/lithologies, alteration styles and grade classes should be developed until more coherent RR groupings are recognized as discrete domains. This typically involves a minimum of 100 samples to adequately cover a sample selection matrix. As for any geometallurgical style attribute or domaining exercise an extensive sampling and testing program eventually involving thousands of samples, may be required to support domaining in situations of high variability. As the database grows assignment of average RR by geological category is generally undertaken.
For extensive multi-element data RR’s for individual elements can be comparatively ranked to highlight associations which typically provide information on probable controls. In the case of the mesothermal gold example a very strong correlation between high RR for Au, Bi, Ag and S is evident. In the case of the porphyry Cu example Mo shows high RR while Cu, Zn, Ag, S, Pb and Cu show a closeting of moderate RR. This may indicate that the moderate Cu RR response is related to late stage base metal-bearing veins rather than earlier paragenetic Cu associations in veins or disseminations which are not reporting as preferential grade by size related breakage.
The Response Ranking approach developed by CRC ORE allows grade by size data to be systematically and routinely processed and interpreted for qa/qc. This facilitates comparative ranking between deposits and definition of variability and domaining within deposits. Comparative ranking is particularly suited for testing of coarse assay residues where the residues have been generated using a constrained sample preparation and size reduction approach.
Although generating grade by size data and more recently processing and interpreting this data is relatively straightforward, systematic databases of grade by size data from drill core testing, production scale testing (e.g. belt cuts or trucks) or mill surveys, remains rare in the industry. This lack of data means that grade by size opportunity is typically overlooked on most operations stressing the importance of undertaking rapid assessment programs. CRC ORE continues to generate a significant centralized database of grade by size data across a range of deposit styles and sample types which can increasingly be used to rank and compare individual sites against a global dataset. Response Rankings above 60 for drill core scale testing indicate potential for grade by size to be considered as a dominant Grade Engineering value driver.
Response Rankings are mathematical functions that can be used as inputs into a range of CRC ORE modelling and simulation software to determine operational Grade Engineering scenarios and value. Response Rankings are not related to or dependent on head grade, which acts as a modifying attribute. The higher the RR the higher the potential to use grade by size and resulting screening to separate new accept and reject type #feed streams. RR by itself does not indicate what mass pull gives optimum upgrade or what grade categories it should be applied to. These are dynamic operational decisions driven by RR but optimized by operational considerations and economics.
Download the RR data used in this analysis

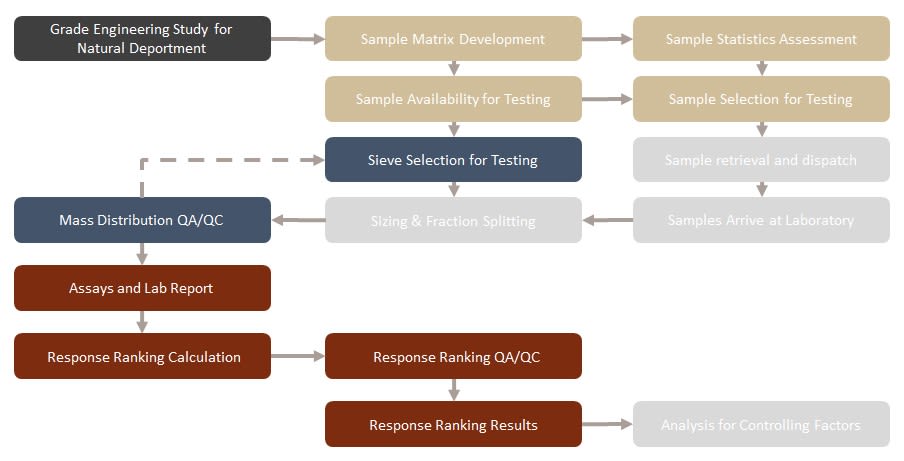
Workflow for Natural Deportment Characterisation
Domaining Variability Responses
Once analysis has been completed this information passed on for population into the Grade Engineering block model. More detail on specific methodologies used for this can be found here.
Production Scale-Up
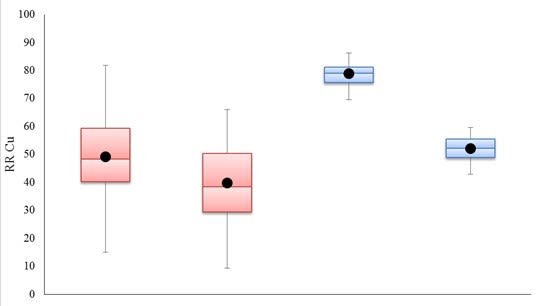
Previous CRC ORE studies have observed a relatively consistent increase in Response Rankings when moving from drill core variability testing scale to production scale. This difference is usually accounted for in what is referred to as a “scale-up Factor”. This is applied across all drill core test results to bring them into line with expected production scale responses. Studies to date have found two common scale-up Factors; the first at approximately x1.20 and a second at x1.60. This has been observed to vary both across and within a given site.
CRC ORE has observed only a single case where production scale responses were lower than those measured at drill core scale (scale-up Factor = x0.50).
Example of normal scale-up relationship between drill core (red) and bulk samples (blue).
Bulk testing
bulk testing is critical in determining both production scale responses and associated scale-up factors for drill core results. Ideally ROM or post primary crusher material should be sampled and evaluated using the exact same protocols as variability testing to determine; ideal sizes, grades, response factors and Response Rankings.
More detail on how to effectively sample bulk material is found here.
Production Trials
Details on conducting Production Trials can be found here: [Site Trials](https://wikiore.com.au/Site Trials)
Previous Section: Methods | ((Induced deportment Characterisation|Next Section: Induced deportment Characterisation))

